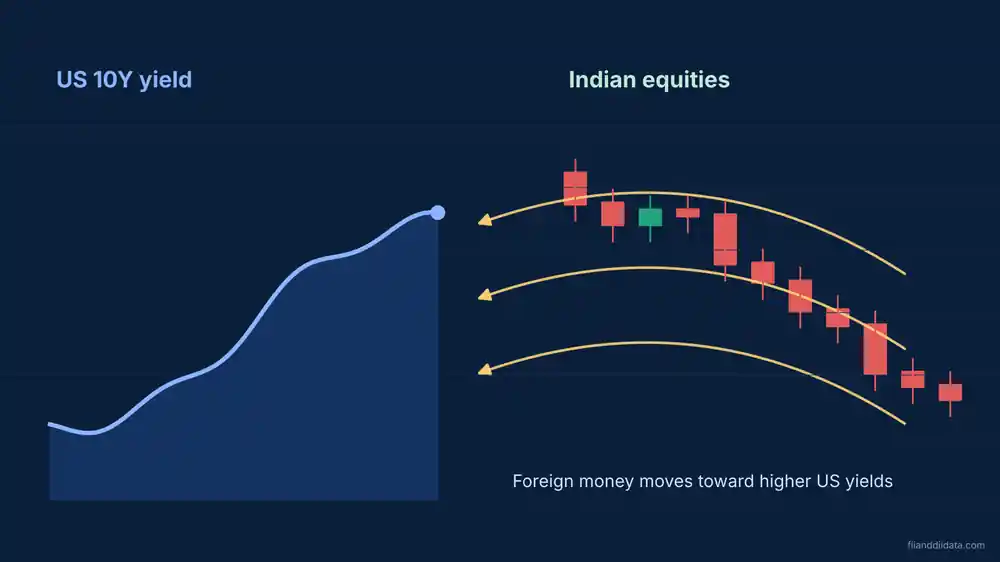
Does heavy FII selling really crash the market? This FII selling vs Nifty returns study answers that with 2026 data. We matched every month’s FII and DII net cash flow with the Nifty 50 return for that month and the month after, and checked what the Nifty did the day after the biggest FII selling sessions.
Key findings (January to October 2026)
- In the five completed months with FII selling above ₹40,000 crore (March, April, May, June, September), the Nifty fell in three and rose in two, with an average monthly return of -2.16%.
- March 2026 was the worst: FIIs sold ₹1,22,540 crore and the Nifty fell 9.37%. April then bounced 5.16%.
- On the seven days when FIIs sold more than ₹5,000 crore between 28 September and 15 October, the Nifty fell the next day four times and rose three times.
- Heavy FII selling alone is a weak signal. What DIIs do on the other side matters as much.
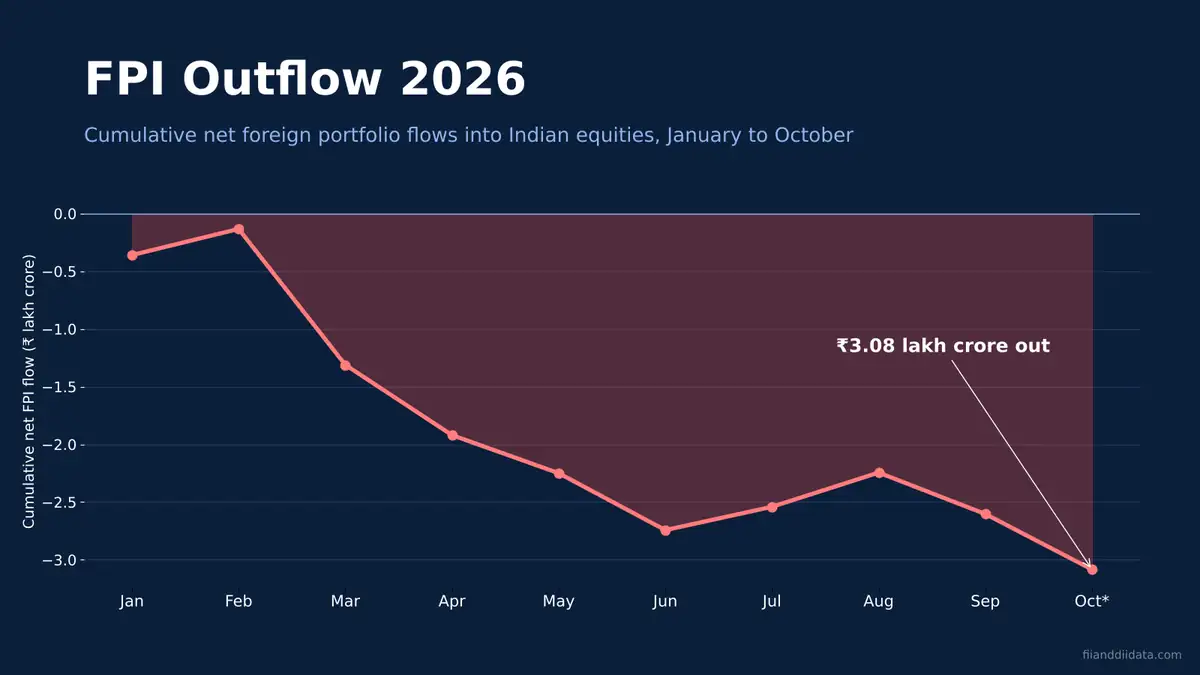
FII Selling vs Nifty Returns: Month-wise Table 2026
| Month | FII Net (₹ Cr) | DII Net (₹ Cr) | FII + DII (₹ Cr) | Nifty 50 Close | Nifty Return | Next Month Return |
|---|---|---|---|---|---|---|
| January | -41,435 | +69,221 | +27,786 | 25,320.65 | -3.10% | -0.56% |
| February | -6,641 | +38,423 | +31,782 | 25,178.65 | -0.56% | -9.37% |
| March | -1,22,540 | +1,42,960 | +20,420 | 22,819.60 | -9.37% | +5.16% |
| April | -70,135 | +51,064 | -19,071 | 23,997.55 | +5.16% | -1.87% |
| May | -55,963 | +82,669 | +26,706 | 23,547.75 | -1.87% | +1.35% |
| June | -49,029 | +85,800 | +36,771 | 23,865.75 | +1.35% | +2.17% |
| July | -5,779 | +35,099 | +29,320 | 24,383.60 | +2.17% | -1.24% |
| August | -7,532 | +58,268 | +50,736 | 24,080.40 | -1.24% | -6.06% |
| September | -44,013 | +76,030 | +32,017 | 22,620.45 | -6.06% | -0.09%* |
| October (till 23 Oct) | -51,466 | +59,110 | +7,644 | 22,600.00 | -0.09%* | – |
What the 2026 FII Selling vs Nifty Data Shows
1. Big FII selling months were weak months, but not always
Of the five completed months with more than ₹40,000 crore of FII selling, March (-9.37%), May (-1.87%) and September (-6.06%) were negative. April (+5.16%) and June (+1.35%) were positive even though FIIs sold ₹70,135 crore and ₹49,029 crore. The average return across the five months was -2.16%.
2. Light FII selling did not guarantee gains
FIIs sold less than ₹10,000 crore in February, July and August. The Nifty returned -0.56%, +2.17% and -1.24% in those months. Global factors such as crude oil, the rupee and US bond yields also move the index.
3. The day after a heavy FII selling session
| Date | FII Net (₹ Cr) | Nifty Next Day |
|---|---|---|
| 28 Sep 2026 | -5,353 | -0.28% |
| 29 Sep 2026 | -9,980 | -0.42% |
| 30 Sep 2026 | -10,148 | -0.88% |
| 01 Oct 2026 | -9,484 | +0.60% |
| 07 Oct 2026 | -6,121 | -1.64% |
| 08 Oct 2026 | -12,944 | +1.30% |
| 15 Oct 2026 | -5,285 | +0.65% |
The Nifty went both ways after big selling days. The average next-day move was close to zero. On 8 October, the biggest selling day, DIIs bought ₹10,703 crore and the Nifty rose 1.30% the following session.
How to Use FII Selling Data for Nifty Decisions
- Look at FII and DII together. A month like April, when FII selling was larger than DII buying, is the real warning sign.
- Watch the trend, not a single day. Use the FII flow vs Nifty chart for the last 20 sessions.
- Check derivatives positioning with the FII long short ratio.
- Remember the sample is small: ten months is not enough to build a trading rule.
FII Selling vs Nifty Returns: FAQs
Does heavy FII selling make the Nifty fall?
Often, but not always. In 2026, three of the five completed months with more than ₹40,000 crore of FII selling ended lower, and two ended higher. DII buying and global factors also decide the direction.
What was the worst month for FII selling and the Nifty in 2026?
March 2026. FIIs sold ₹1,22,540 crore and the Nifty 50 fell 9.37% to 22,819.60.
Can FII data predict the Nifty?
Not on its own. FII flows show where big foreign money is moving, but the 2026 data shows mixed results. Combine it with DII flows, derivatives data and price action.
Sources: NSE provisional FII/FPI and DII cash market data (monthly totals as on our FII DII monthly data page); Nifty 50 monthly and daily closes from Investing.com and Devyara. Data checked on 26 October 2026. Disclaimer: Past patterns do not guarantee future returns. For educational purposes only, not investment advice.