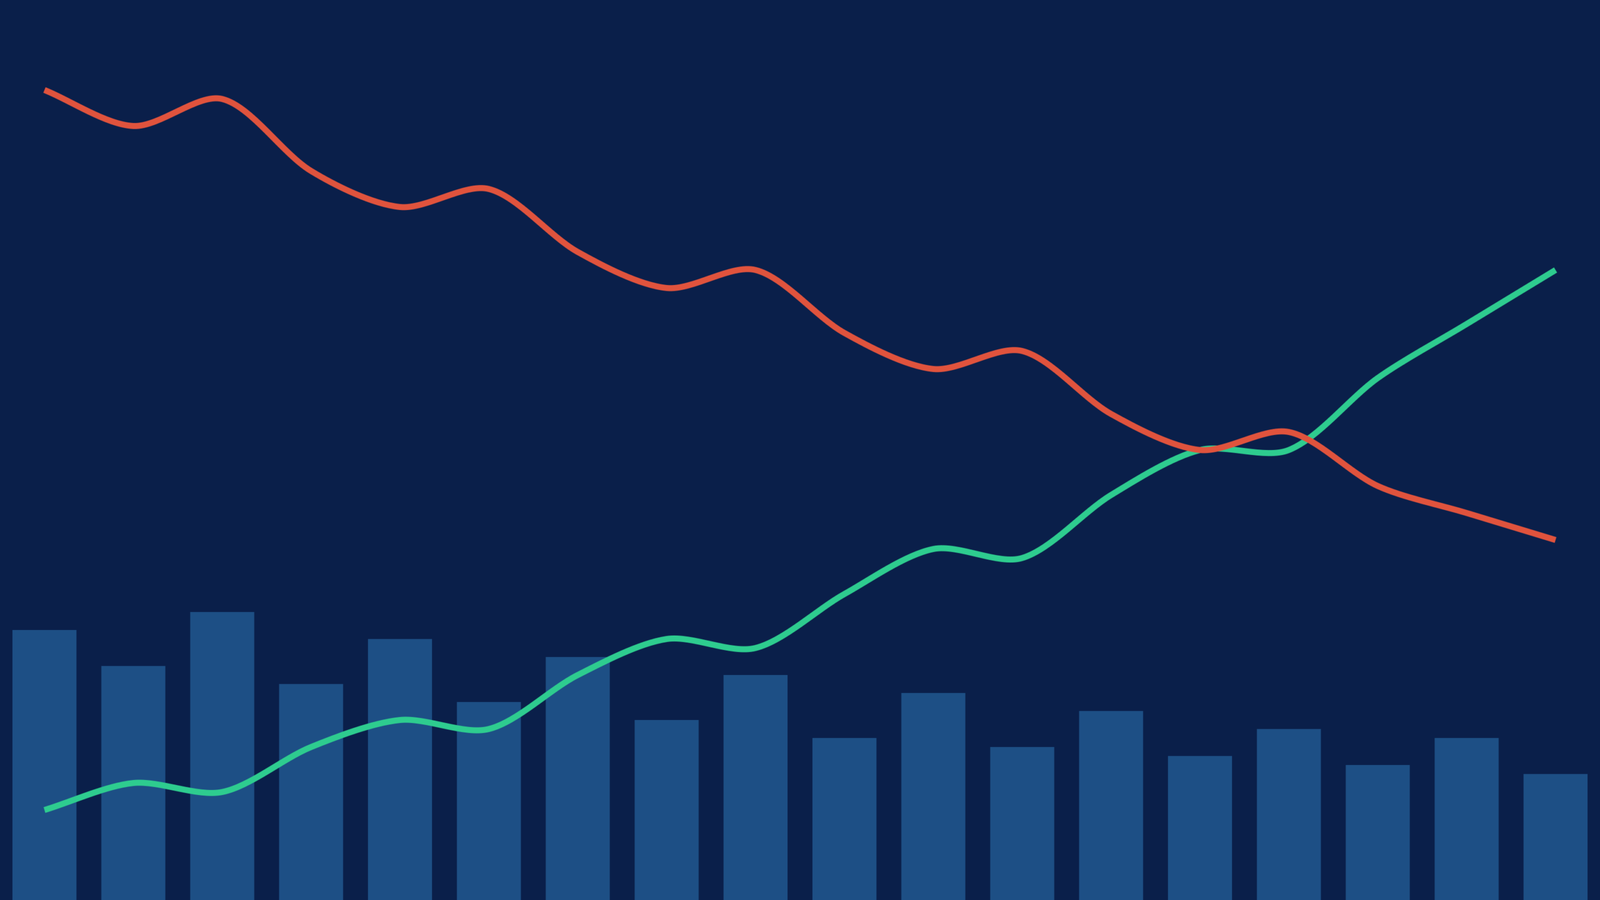
This FII flow vs Nifty chart puts three numbers on one screen: how much foreign institutional investors (FIIs) bought or sold, how much domestic institutional investors (DIIs) bought or sold, and where the Nifty 50 closed. It covers the last 20 trading sessions and updates automatically after each trading day.
FII vs DII net flow and Nifty 50: last 20 sessions (25 Sep – 26 Oct 2026)
FII net DII net Nifty 50 close
Show the numbers
| Date | FII Net | DII Net | Nifty 50 Close |
|---|---|---|---|
| 26 Oct 2026 | -₹1,462 Cr | +₹2,610 Cr | 22,753 |
| 23 Oct 2026 | +₹888 Cr | +₹3,235 Cr | 22,600 |
| 22 Oct 2026 | -₹3,459 Cr | +₹2,891 Cr | 22,688 |
| 21 Oct 2026 | +₹1,022 Cr | +₹1,614 Cr | 22,811 |
| 19 Oct 2026 | -₹1,149 Cr | +₹3,201 Cr | 22,889 |
| 16 Oct 2026 | +₹1,166 Cr | -₹3,661 Cr | 23,146 |
| 15 Oct 2026 | -₹5,285 Cr | +₹3,319 Cr | 22,997 |
| 14 Oct 2026 | -₹1,857 Cr | +₹2,670 Cr | 22,623 |
| 13 Oct 2026 | -₹1,305 Cr | +₹2,439 Cr | 22,722 |
| 12 Oct 2026 | -₹1,708 Cr | +₹3,045 Cr | 22,363 |
| 09 Oct 2026 | -₹3,569 Cr | +₹4,743 Cr | 22,520 |
| 08 Oct 2026 | -₹12,944 Cr | +₹10,703 Cr | 22,232 |
| 07 Oct 2026 | -₹6,121 Cr | +₹4,597 Cr | 22,603 |
| 06 Oct 2026 | -₹2,961 Cr | +₹5,089 Cr | 22,776 |
| 05 Oct 2026 | -₹4,699 Cr | +₹5,182 Cr | 22,556 |
| 01 Oct 2026 | -₹9,484 Cr | +₹10,042 Cr | 22,422 |
| 30 Sep 2026 | -₹10,148 Cr | +₹11,272 Cr | 22,620 |
| 29 Sep 2026 | -₹9,980 Cr | +₹6,953 Cr | 22,716 |
| 28 Sep 2026 | -₹5,353 Cr | +₹5,189 Cr | 22,780 |
| 25 Sep 2026 | -₹3,694 Cr | +₹2,838 Cr | 23,140 |
Source: NSE provisional cash market data; Nifty 50 closing values. Updated 26 Oct 2026.
How to Read the FII Flow vs Nifty Chart
- Red bars show FII net buying (above zero) or net selling (below zero) in the cash market, in ₹ crore.
- Green bars show DII net buying or selling on the same day.
- The blue line is the Nifty 50 closing value, read on the right-hand scale.
- Tap Show the numbers under the chart for the exact daily figures.
What the Recent FII Flow vs Nifty Data Shows
Heavy FII selling does not always push the Nifty down the same day. On 8 October 2026, FIIs sold ₹12,944 crore, the largest single-day sale in this window, and the Nifty fell 1.64% to 22,231.80. The next day it rose 1.30%, because DIIs had bought ₹10,703 crore on the sell day itself. Across the 15-session FII selling streak from 24 September to 15 October 2026, FIIs sold ₹84,135 crore and DIIs bought ₹82,382 crore, absorbing about 98% of the supply. The Nifty slipped only 0.62% between 25 September and 15 October.
The lesson: the gap between FII selling and DII buying matters more than the FII number alone. When DII buying stays close to FII selling, the index tends to hold. When FII selling clearly outpaces DII buying, the pressure shows up in the price.
Related FII DII Data Tools
- FII DII data today: cash market daily summary
- FII DII records board: biggest selling days and longest streaks
- FII selling vs Nifty returns: what happened to the Nifty after heavy FII selling
- FII DII monthly data 2026
FII Flow vs Nifty: FAQs
Does FII selling always make the Nifty fall?
No. On 8 October 2026 FIIs sold ₹12,944 crore and the Nifty fell 1.64%, but it rose 1.30% the next day. When DIIs buy almost as much as FIIs sell, the index often holds steady.
How often is this chart updated?
After every trading day, once NSE publishes the provisional FII and DII cash market figures, usually in the evening.
Which data does the chart use?
NSE provisional FII/FPI and DII net cash market figures in ₹ crore, and the official Nifty 50 closing value for each session.
Sources: NSE provisional FII/FPI and DII cash market data; Nifty 50 closing values from Investing.com historical data. Disclaimer: For educational purposes only, not investment advice. Please consult a SEBI-registered advisor before investing.