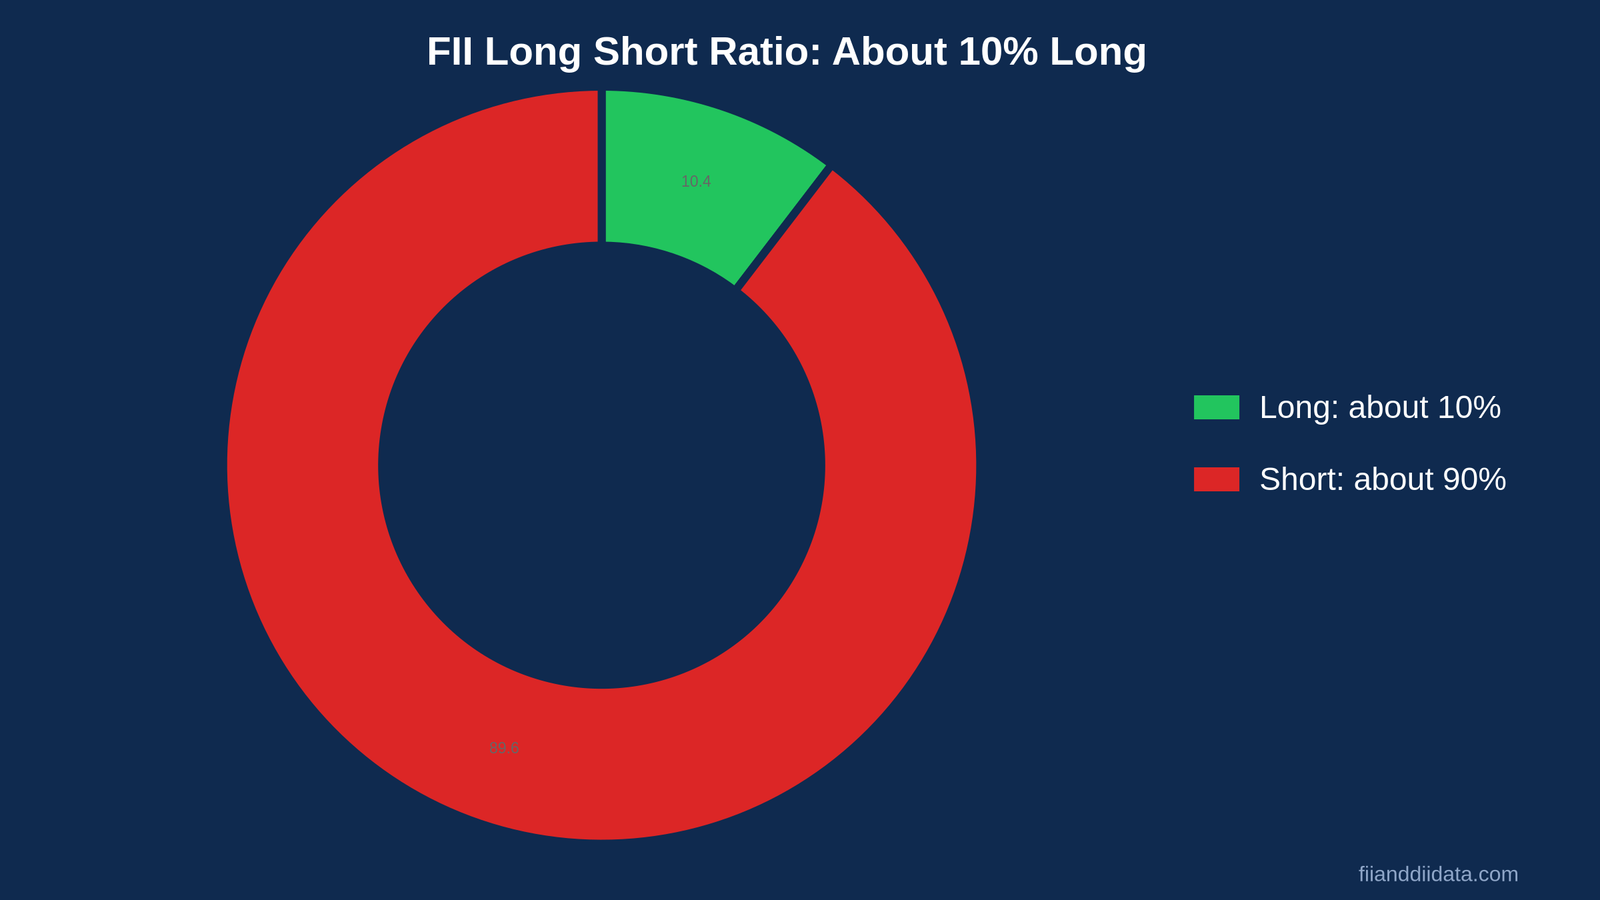
The FII long short ratio tells you what share of foreign investors’ index futures positions are bets on a rising market. On 23 October 2026 it stood near 10%, so FIIs held roughly nine short contracts for every long one. That is close to the lowest levels on record, and it explains why Nifty rallies have struggled to hold this month.
Key Takeaways
- The ratio is FII index futures longs divided by total FII index futures contracts.
- FIIs were about 10% long and net short 2,80,183 contracts on 23 October 2026.
- In 2026, the ratio stayed below 15% on 142 of 186 sessions up to 5 October.
- Part of the FII short is a hedge on their share holdings, not a pure bet on a fall.
- A steady climb toward 25% to 30% with FII cash buying has been the more reliable turn signal.
In this guide:
- What Is the FII Long Short Ratio?
- How to Read the Levels
- Formula and Worked Example
- Latest Data: October 2026
- Is a Low Ratio Always Bearish?
- Signals of a Market Turn
- Common Mistakes
- Where to Find the Data
- FAQs
- The Bottom Line
What Is the FII Long Short Ratio?
Every trading day, NSE publishes how many futures and options contracts four groups hold long and short: Client, DII, FII and Pro. This file is called participant wise open interest (OI). Open interest simply means contracts that are still open and not yet closed or expired.
The ratio uses only one part of that file: FII positions in index futures, which cover Nifty, Bank Nifty and other index futures together. Index futures are the cleanest read on FII direction. Options can be hedges, income trades or bets, and stock futures are spread across hundreds of companies, but an index future is a plain view on the whole market. Before we get to the maths, it helps to know what the numbers usually mean.
How to Read FII Long Short Ratio Levels
There is no official rulebook. Most derivatives traders use zones like these for the long ratio:
| Long ratio | FII positioning | What traders usually read |
|---|---|---|
| Above 70% | Strongly long | Bullish trend, but crowded longs can lead to profit booking |
| 50% to 70% | Mildly long | Positive bias, healthy uptrend |
| 30% to 50% | Mildly short | Cautious, range-bound or hedged |
| 15% to 30% | Heavily short | Bearish trend in progress |
| Below 15% | Extreme short | Very bearish, but also the zone where sharp short-covering rallies have started |
Since April 2025 the ratio has ranged from 6.0% on 30 September 2025 to 52.2% on 8 May 2025, according to OIData’s series of NSE data. In 2026 up to 5 October, it was below 15% on 142 of 186 sessions and below 10% on 47, with a median of 12.1% and a peak of 29.2% on 23 February.
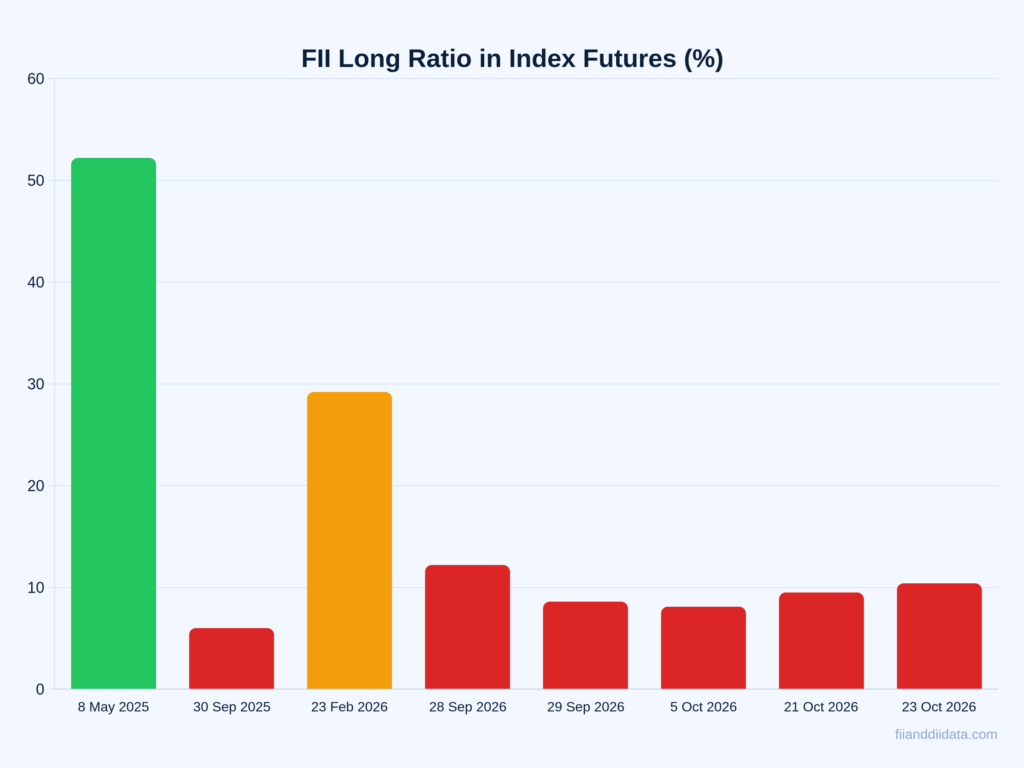
The direction of change matters more than the level. A move from 8% to 15% over a week says far more than one day at 8%. With the zones in mind, here is how the number is built.
FII Long Short Ratio Formula and Worked Example
Websites quote the same data in three ways, so check which one you are looking at.
| Version | Formula | Neutral level |
|---|---|---|
| Long ratio (%), most common in India | Long ÷ (Long + Short) × 100 | 50% |
| Long to short ratio | Long ÷ Short | 1.0 |
| Net position | Long minus Short | 0 |
Worked Example: FII Long Short Ratio on 5 October 2026
On 5 October 2026, FIIs held 29,117 long and 3,31,508 short index futures contracts.
- Total contracts: 29,117 + 3,31,508 = 3,60,625.
- Long ratio: 29,117 ÷ 3,60,625 × 100 = 8.1%, so 91.9% of positions were short.
- Long to short ratio: 29,117 ÷ 3,31,508 = 0.09 to 1.
- Net position: 29,117 minus 3,31,508 = -3,02,391 contracts.
Now suppose FIIs had covered 50,000 shorts and added 20,000 longs. Longs would be 49,117 and shorts 2,81,508, so the ratio would rise to 49,117 ÷ 3,30,625 = 14.9%. That shows how a move out of single digits needs real short covering, not just a few new longs. Next, the actual October numbers.
FII Long Short Ratio in October 2026: Latest Data
| Date | FII long | FII short | Long ratio | Net position |
|---|---|---|---|---|
| 28 Sep 2026 | 51,567 | 3,71,236 | 12.2% | -3,19,669 |
| 29 Sep 2026 (expiry) | 27,879 | 2,95,186 | 8.6% | -2,67,307 |
| 1 Oct 2026 | n/a | n/a | 8% | -3,10,174 |
| 5 Oct 2026 | 29,117 | 3,31,508 | 8.1% | -3,02,391 |
| 21 Oct 2026 | 32,598 | 3,10,226 | 9.5% | -2,77,628 |
| 22 Oct 2026 | n/a | n/a | n/a | -2,80,300 |
| 23 Oct 2026 | about 36,900 | about 3,17,100 | about 10.4% | -2,80,183 |
Between 5 and 23 October, the FII net short shrank by about 22,000 contracts and the long ratio crept from 8.1% to about 10%. That is mild covering, not a reversal. On 1 October, when the ratio hit 8%, its lowest since 23 July, Nifty closed at 22,421.95, down 14.25% for the year, as reported by Business Standard. Motilal Oswal’s Chandan Taparia noted then that longs had stayed below 10% for some time without triggering a recovery.
Who Is on the Other Side of the FII Short?
| Participant | Index futures net position, 23 Oct 2026 | Change vs 22 Oct |
|---|---|---|
| FII | -2,80,183 | +117 |
| Client | +2,15,308 | -2,977 |
| DII | +39,380 | +1,610 |
| Pro | +25,495 | +1,250 |
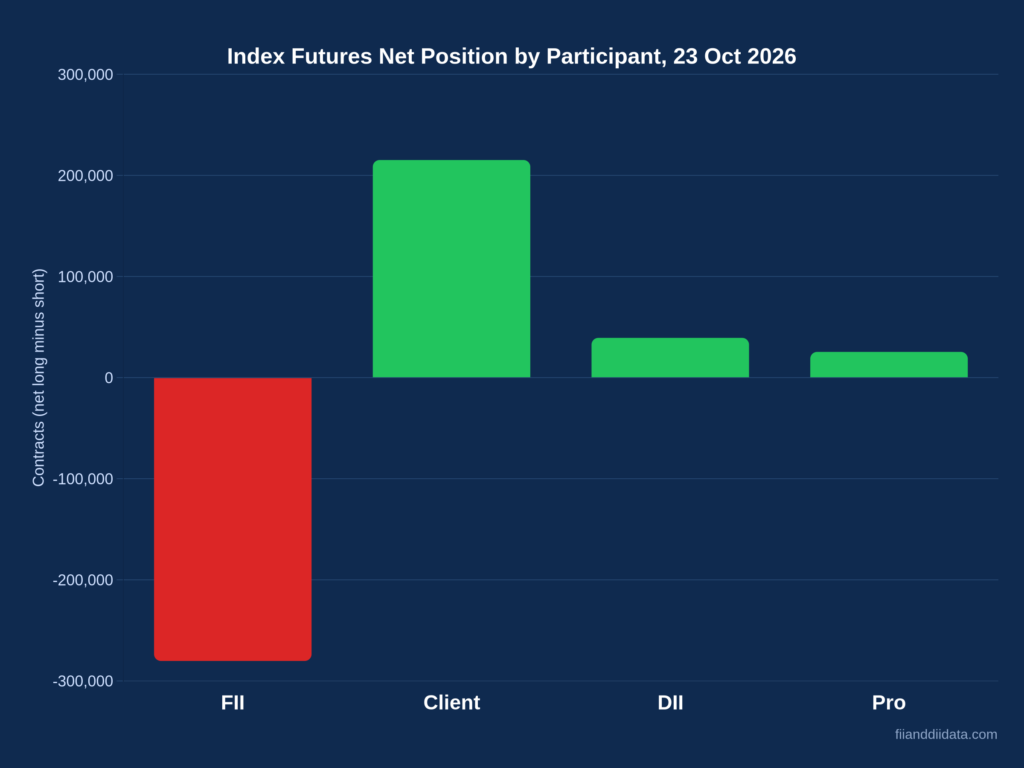
Every futures contract has a buyer and a seller, so a large FII short means someone else is long. Right now that is mostly the Client group, which is largely retail and HNI traders. Marketcalls’ study of NSE data found clients were about 84% long in index futures in September 2026, the most one-sided retail positioning in ten years of data. You can track these numbers daily on our FII long short ratio data page. But does a low reading always mean FIIs expect a fall?
Is a Low FII Long Short Ratio Always Bearish?
Not always. FIIs own lakhs of crores of Indian shares, and shorting index futures is a cheap way to protect that portfolio without selling the shares. Part of the short is insurance, part is arbitrage against cash positions, and only part is a direct bet on a fall.
- Record streak: FIIs had been net short Nifty index futures on every session from 13 May 2025, a run of 333 sessions by mid-September 2026, more than double the previous record (Marketcalls).
- Bigger book, bigger hedge: a 2.8 lakh contract short today is not comparable with a 1.4 lakh short in 2019, because FII holdings are much larger now.
- Mixed history: of 15 FII short streaks of 20 or more sessions over ten years, Nifty finished higher in 8 by the end of the streak.
- Turning points: the 42-session streak in February and March 2020 ended with FIIs flipping long on 24 March 2020, which marked that year’s bottom.
So the level tells you FIIs are defensive. It does not tell you the next move. For that, traders watch for a specific set of changes.
FII Long Short Ratio Signals to Watch for a Market Turn
- The long ratio climbs from single digits toward 25% to 30% and stays there.
- The FII net short falls for five or more sessions in a row.
- FIIs turn net buyers in the cash market on the FII DII cash market daily summary.
- FII put writing rises on the FII options activity tracker, a sign big players expect a floor.
- Client longs start to unwind, which usually means retail selling pressure is close to exhausted.
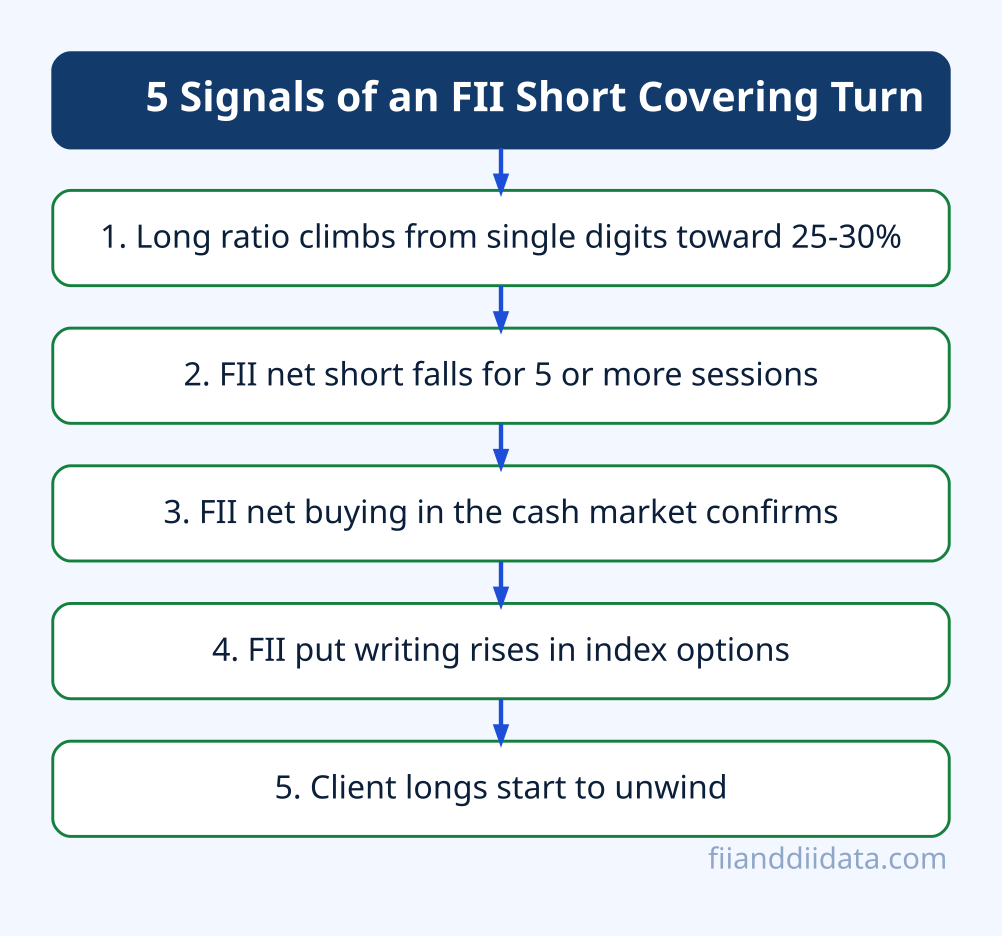
No single signal is enough. In October 2026, the ratio has edged up, but FII cash flows are still mixed: FIIs bought a net ₹888 crore on 23 October after heavy selling earlier in the month. Our weekly FII DII report tracks how these pieces line up. Even with a checklist, a few errors are common.
Common Mistakes With the FII Long Short Ratio
- Reading one day: expiry days distort the numbers. On 29 September 2026 the ratio fell to 8.6% from 12.2% a day earlier as contracts rolled.
- Mixing formulas: a long to short ratio of 0.11 and a long ratio of 10% describe the same position.
- Ignoring size: the ratio counts contracts, not rupee value or entry price.
- Expecting intraday updates: NSE publishes the file once, after market close.
- Trading it alone: without cash flows and options data, the ratio can keep a trader short through a sharp short-covering rally.
Avoiding these mistakes starts with getting the data from the right place.
Where to Find FII Long Short Ratio Data
- Open the official NSE derivatives reports page.
- Select the trading date.
- Download the F&O participant wise open interest file (CSV).
- In the FII row, take Future Index Long and Future Index Short and apply the formula above.
To skip the spreadsheet, use our FII DII F&O activity dashboard. For the bigger picture behind the shorts, read why FIIs are selling Indian stocks and our explainer on FII vs FPI.
Frequently Asked Questions
What is the FII long short ratio today?
On 23 October 2026, FIIs were about 10% long in index futures, with a net short of 2,80,183 contracts. The figure changes every trading day after NSE publishes participant wise open interest data in the evening.
How is the FII long short ratio calculated?
Divide FII index futures long contracts by the total of long and short contracts, then multiply by 100. On 5 October 2026 that was 29,117 divided by 3,60,625, or 8.1%. Some sites instead divide long by short, where 1.0 is neutral.
Is a low FII long short ratio bullish or bearish?
A low ratio shows FIIs are bearish or heavily hedged. Very low readings, below about 15%, have often appeared near market bottoms, because shorts must eventually be covered. It is a warning sign, not a timing tool.
Does the FII long short ratio include options?
No. The standard ratio uses index futures only. FII call and put positions are tracked separately because options are often used for hedging and income, not just direction.
What is a good FII long short ratio for Nifty?
Around 50% is neutral. Readings above 50% to 70% usually go with an uptrend, while a steady rise from below 15% toward 25% to 30% has often marked the end of a selling phase.
The Bottom Line
This ratio is one of the simplest ways to see what big foreign money is doing in derivatives. In October 2026 it has sat between 8% and about 10%, near record lows, while retail traders hold the other side. That does not guarantee a further fall, and it does not promise a rally.
Watch the trend, not the single reading. A steady climb toward 25% to 30%, backed by FII buying in the cash market, has historically been the clearer sign that a selling cycle is ending. As a next step, note today’s ratio after NSE’s evening release and compare it with last week’s figure. More explainers are in our FII DII blog.
Sources: NSE participant wise open interest data; OIData, 6 October 2026; Business Standard, 4 October 2026; Marketcalls analysis of NSE data, September 2026; NiftyTrader and Quantsapp participant data, 23 October 2026.
Disclaimer: This article is for educational purposes only and is not investment advice. Please consult a SEBI-registered advisor before making investment decisions.