FII and DII Data
Daily Cash Market, F&O & OI Dashboard
Analyze daily Cash and F&O market activities of Institutional Investors to make data-driven trading decisions.
Site stats from Jetpack, updated weekly. Last updated: 7 Nov 2026.
FII DII Mood Meter
Data for 12 Nov 2026 (NSE provisional)Today in one line: 12 Nov 2026: FIIs bought ₹7,831 crore, DIIs sold ₹6,331 crore; DIIs booked profits into foreign buying. FII buying streak: 3 sessions.
Mood Score combines four FII signals, each worth 25 points: today’s FII cash net, FII cash net over the last 5 sessions, FII index futures net change, and FII index call minus put OI change. FII Streak counts consecutive sessions of FII net buying or selling in cash. DII Absorption = DII net buying ÷ FII net selling this month. Educational only, not investment advice. See full FII DII data · FII DII records · Market calendar.
FII Market Setup (12 Nov 2026): Strong Buying
FIIs bought shares in cash and added net long positions in index futures. FII cash net: +₹7,831 Cr. FII index futures net change: +20,694 contracts.
FII DII data: last 30 sessions (30 Sep – 12 Nov 2026)
08 Oct 2026
Market Setup combines the direction of FII cash flow and FII index futures net change for the same day. Correlation compares daily FII cash net with the Nifty 50 daily change (+1 = move together, -1 = opposite, 0 = no link). Educational only, not investment advice.
Cash Market Daily Summary
Date|FII Buy|FII Sell|FII Net|DII Buy|DII Sell|DII Net
12 Nov 2026|20273|12443|7831|15855|22186|-6331
11 Nov 2026|30087|17524|12563|19704|28139|-8435
09 Nov 2026|20311|13099|7212|12765|19938|-7173
08 Nov 2026|52|53|0|331|1031|-700
06 Nov 2026|30456|16706|13750|18084|24053|-5969
05 Nov 2026|31798|16823|14975|22168|32613|-10445
04 Nov 2026|21607|14323|7284|16393|20105|-3712
03 Nov 2026|20285|13428|6857|14529|18488|-3959
02 Nov 2026|16500|13385|3115|14989|15381|-392
30 Oct 2026|20564|16965|3599|16644|17461|-818
29 Oct 2026|13400|14344|-944|18459|16534|1924
28 Oct 2026|16835|15963|872|17241|16598|643
27 Oct 2026|24518|20277|4240|15703|16953|-1250
26 Oct 2026|9325|10787|-1462|17390|14780|2610
23 Oct 2026|14446|13558|888|19232|15997|3235
22 Oct 2026|13628|17086|-3459|16243|13352|2891
21 Oct 2026|17004|15982|1022|14932|13317|1614
19 Oct 2026|11241|12389|-1149|14781|11580|3201
16 Oct 2026|19952|18786|1166|17202|20863|-3661
15 Oct 2026|12736|18021|-5285|19439|16119|3319
14 Oct 2026|16382|18239|-1857|17429|14758|2670
13 Oct 2026|13465|14771|-1305|16233|13794|2439
12 Oct 2026|12583|14292|-1708|15507|12462|3045
09 Oct 2026|10374|13943|-3569|15627|10883|4743
08 Oct 2026|15725|28669|-12944|22988|12285|10703
07 Oct 2026|12578|18699|-6121|18707|14110|4597
06 Oct 2026|11259|14220|-2961|20146|15057|5089
05 Oct 2026|15675|20374|-4699|20493|15311|5182
01 Oct 2026|12260|21744|-9484|25420|15378|10042
30 Sep 2026|14968|25116|-10148|24414|13142|11272
29 Sep 2026|22473|32453|-9980|46261|39308|6953
28 Sep 2026|9048|14401|-5353|15918|10729|5189
25 Sep 2026|12327|16021|-3694|14036|11198|2838
24 Sep 2026|13111|18139|-5027|18197|13896|4301
23 Sep 2026|13580|11963|1617|14405|12063|2341
22 Sep 2026|9846|13656|-3810|14600|10480|4120
21 Sep 2026|10637|11213|-576|14099|11301|2797
18 Sep 2026|38462|37862|600|17310|16290|1020
17 Sep 2026|8762|11970|-3209|14105|10487|3618
16 Sep 2026|12959|14992|-2033|15280|11371|3908
15 Sep 2026|13195|16173|-2978|15222|12536|2686
11 Sep 2026|12617|13548|-931|15110|13141|1968
10 Sep 2026|11883|12321|-438|13326|12300|1026
09 Sep 2026|16393|16976|-583|18131|16622|1509
08 Sep 2026|11705|11828|-123|14679|13329|1350
07 Sep 2026|9581|9301|280|13154|12587|567
04 Sep 2026|13858|16970|-3112|19254|10324|8930
03 Sep 2026|13596|15942|-2346|17064|12086|4977
02 Sep 2026|26716|20028|6688|17640|14827|2813
01 Sep 2026|17808|16664|1143|15635|13789|1847
31 Aug 2026|60026|68012|-7986|19730|15142|4589
28 Aug 2026|13264|18303|-5040|16539|11355|5184
27 Aug 2026|15277|15575|-298|19606|14628|4977
26 Aug 2026|17520|17018|503|17710|11285|6425
25 Aug 2026|13259|11666|1594|14280|14050|230
24 Aug 2026|12333|11151|1182|15337|12844|2493
21 Aug 2026|12561|13104|-543|15259|13135|2124
20 Aug 2026|11412|11995|-583|16933|13395|3538
19 Aug 2026|12876|12468|408|17289|13315|3974
18 Aug 2026|13543|11892|1652|15566|12987|2579
17 Aug 2026|11546|14081|-2535|16654|11553|5101
14 Aug 2026|12854|12346|508|14295|13939|356
13 Aug 2026|14492|15003|-511|16565|12212|4353
12 Aug 2026|16585|17587|-1002|21519|15677|5842
11 Aug 2026|14628|14370|259|15007|14982|25
10 Aug 2026|13162|11187|1975|15869|17159|-1290
07 Aug 2026|12941|12461|480|15680|15444|236
06 Aug 2026|16161|16179|-18|19724|15710|4014
05 Aug 2026|15940|16884|-943|19353|16470|2883
04 Aug 2026|15630|13184|2446|15241|16178|-936
03 Aug 2026|12622|11700|922|18326|16755|1571
31 Jul 2026|19046|18768|277|19886|17625|2260
30 Jul 2026|17432|13808|3624|17980|19844|-1864
29 Jul 2026|17358|14376|2982|18176|17178|998
28 Jul 2026|17531|16776|755|18257|16593|1664
27 Jul 2026|11696|13384|-1688|15937|13608|2329
24 Jul 2026|11124|15017|-3893|18959|13506|5454
23 Jul 2026|11472|14471|-2999|16575|13628|2947
22 Jul 2026|12890|13709|-819|13666|14084|-418
21 Jul 2026|16328|14678|1650|14639|15295|-657
20 Jul 2026|13313|14434|-1121|16188|14876|1312
17 Jul 2026|14394|14770|-376|17180|16162|1018
16 Jul 2026|13576|17782|-4206|19237|16250|2986
15 Jul 2026|13207|13943|-736|16226|15521|705
14 Jul 2026|12763|13503|-740|20421|17493|2928
13 Jul 2026|10386|13449|-3062|17393|15222|2172
10 Jul 2026|15318|12714|2604|17172|15152|2020
09 Jul 2026|14388|14921|-533|18303|16245|2058
08 Jul 2026|17464|15501|1963|19165|18375|790
07 Jul 2026|18414|18021|393|18897|19281|-383
06 Jul 2026|11686|11443|243|19728|15936|3791
03 Jul 2026|13337|11982|1355|18676|20630|-1954
02 Jul 2026|14018|14330|-312|17392|15607|1784
01 Jul 2026|11623|12764|-1140|17137|13977|3159
30 Jun 2026|23274|25830|-2557|23433|16590|6842
29 Jun 2026|24754|26104|-1350|55274|52472|2801
25 Jun 2026|18988|18604|384|24844|19096|5748
24 Jun 2026|16745|18588|-1843|17274|13637|3637
23 Jun 2026|15396|15378|18|16863|16183|680
22 Jun 2026|10082|10718|-636|17392|16356|1036
19 Jun 2026|31443|26584|4859|18020|19180|-1160
18 Jun 2026|14612|15637|-1025|16163|12646|3517
17 Jun 2026|14806|14705|102|16612|15050|1561
16 Jun 2026|13887|14636|-749|13553|13553|0
15 Jun 2026|15650|15450|200|21081|17892|3189
12 Jun 2026|12065|13147|-1082|18877|13536|5341
11 Jun 2026|14001|15988|-1987|16823|12598|4225
10 Jun 2026|14048|16173|-2125|17396|14272|3124
09 Jun 2026|14735|19302|-4566|17665|11506|6159
08 Jun 2026|8842|14398|-5556|16683|11518|5165
05 Jun 2026|11045|19821|-8776|22779|13646|9134
04 Jun 2026|14013|18460|-4447|16824|12464|4360
03 Jun 2026|17054|22670|-5617|17530|11789|5741
02 Jun 2026|16956|25319|-8363|22509|12919|9589
01 Jun 2026|17726|21638|-3912|15226|10117|5109
29 May 2026|89734|110840|-21106|37000|20236|16764
27 May 2026|11419|12461|-1043|16893|13072|3821
26 May 2026|13127|15535|-2408|15537|14175|1361
25 May 2026|12083|11261|822|16435|12578|3857
22 May 2026|10973|15413|-4440|18437|12433|6004
21 May 2026|12322|14213|-1891|15857|13365|2492
20 May 2026|14140|15737|-1597|16001|14032|1968
19 May 2026|17908|20365|-2457|16952|13150|3802
18 May 2026|17222|14408|2814|16845|14163|2682
15 May 2026|16300|14970|1329|14962|16921|-1959
14 May 2026|17351|17163|187|18256|17572|684
13 May 2026|14374|19077|-4703|18873|13004|5869
12 May 2026|16555|18515|-1959|20685|12695|7990
11 May 2026|12814|21251|-8438|21626|15687|5940
08 May 2026|15083|19194|-4111|21297|14549|6748
07 May 2026|17998|18339|-341|17032|16591|441
06 May 2026|14459|20294|-5835|22888|16051|6837
05 May 2026|10393|14014|-3622|16234|13632|2603
04 May 2026|19660|16825|2836|19516|14752|4764
12 Nov 2026|172115|-47|54372|-4|70744|13518|25432|-1018|114170|9016|27224|0|120463|-7176|60806|10609|3402088|356345|2661|51|774429|51773|1201859|149409|3254568|547966|1600|50|982538|24281|1142331|-14720|3246842|524531|107306|264|1097979|3152|1142747|187993|3635977|495016|1200|0|719084|71589|1238613|149335|3162126|22860|344641|3806|3576742|1210|728203|23577|376004|28954|4302204|-27421|2551402|11248|582102|38672|2132835|166846|2741|-34|330725|251|1361646|33593|1176409|53245|442624|8190|446804|19905|1762110|119316|1276708|42755|40248|-1060|416801|1752|1069755|31951|1186294|39269|32571|-1788|328820|6564|1255827|31353
11 Nov 2026|172162|-10650|54376|-915|57226|4844|26450|-2377|105154|3101|27224|2390|127639|-15484|50197|895|3045743|933042|2610|-11283|722656|115978|1052450|246391|2706602|624696|1550|1250|958257|239626|1157051|418556|2722311|295379|107042|2810|1094827|125155|954754|97704|3140961|330690|1200|1200|647495|65462|1089278|123696|3139266|-41825|340835|1234|3575532|-5208|704626|21506|347050|5246|4329625|-26038|2540154|-5835|543430|2334|1965989|125788|2775|59|330474|11185|1328053|66376|1123164|35674|434434|10254|426899|27281|1642794|130199|1233953|54824|41308|-141|415049|19166|1037804|31170|1147025|40134|34359|1802|322256|15136|1224474|47947
09 Nov 2026|182812|1984|55291|1287|52382|3726|28827|-724|102053|5006|24834|6366|143123|-5949|49302|850|2112701|-793485|13893|3075|606678|-254598|806059|-335800|2081906|-812886|300|-253|718631|-270269|738495|-297398|2426932|-1643104|104232|-718|969672|-409544|857050|-672690|2810271|-1663936|0|-1003|582033|-347442|965582|-713676|3181091|41174|339601|9552|3580740|-24694|683120|-1527|341804|21292|4355663|-37658|2545989|19758|541096|21113|1840201|196132|2716|353|319289|9030|1261677|34114|1087490|46703|424180|37166|399618|33374|1512595|122386|1179129|83076|41449|-165|395883|9395|1006634|22547|1106891|55996|32557|1042|307120|10573|1176527|47242
06 Nov 2026|180828|-6612|54004|87|48656|-3381|29551|858|97047|14248|18468|9677|149072|-40403|48452|7430|2906186|145968|10818|2235|861276|58450|1141859|45617|2894792|225479|553|-100|988900|32326|1035893|-5435|4070036|751994|104950|536|1379216|142512|1529740|240356|4474207|729117|1003|400|929475|118856|1679258|287025|3139917|-1546|330049|7479|3605434|-5471|684647|7833|320512|14061|4393321|-22846|2526231|2676|519983|14404|1644069|39135|2363|-214|310259|29975|1227563|75271|1040787|3912|387014|28517|366244|28052|1390209|83686|1096053|53215|41614|157|386488|35967|984087|59962|1050895|19602|31515|88|296547|33594|1129285|96017
05 Nov 2026|187440|-28501|53917|4570|52037|17198|28693|-116|82799|16651|8791|1762|189475|-31343|41022|6081|2760218|54558|8583|-5700|802826|144636|1096242|99032|2669313|55558|653|-21|956574|76407|1041328|160581|3318042|636814|104414|-8792|1236704|176024|1289384|194358|3745090|565632|603|400|810619|171026|1392233|261347|3141463|-52096|322570|19133|3610905|2195|676814|-15811|306451|34592|4416167|-94862|2523555|-41992|505579|55683|1604934|46241|2577|160|280284|43299|1152292|94840|1036875|15628|358497|20750|338192|22801|1306523|125361|1042838|69880|41457|-255|350521|31931|924125|41829|1031293|47738|31427|2160|262953|35489|1033268|57998
04 Nov 2026|215941|-3755|49347|-536|34839|1691|28809|369|66148|-70|7029|250|220818|-15087|34941|12676|2705660|604955|14283|6355|658190|157123|997210|226931|2613755|558526|674|200|880167|190900|880747|245739|2681228|508429|113206|-400|1060680|142240|1095026|347914|3179458|571835|203|-200|639593|161109|1130886|265440|3193559|-6874|303437|14937|3608710|-15901|692625|-13982|271859|12996|4511029|-35906|2565547|-20060|449896|21150|1558693|87329|2417|1179|236985|17118|1057452|63495|1021247|40435|337747|15916|315391|35841|1181162|76929|972958|59621|41712|104|318590|27480|882296|27583|983555|48021|29267|1035|227464|14094|975270|51638
03 Nov 2026|219696|-20867|49883|2441|33148|1957|28440|-3302|66218|5105|6779|309|235905|-28485|22265|3300|2100705|-1010131|7928|250|501067|-184225|770279|-377766|2055229|-1091977|474|-429|689267|-200270|635008|-279196|2172799|-1840070|113606|-340|918440|-357466|747112|-555020|2607623|-1986872|403|-200|478484|-252809|865446|-513016|3200433|-43932|288500|14708|3624611|3145|706607|-23370|258863|24568|4546935|-50219|2585607|-47782|428746|23984|1471364|33836|1238|80|219867|31900|993957|76786|980812|19734|321831|43893|279550|24977|1104233|53998|913337|58622|41608|-1517|291110|34241|854713|14166|935534|19714|28232|4219|213370|35605|923632|45974
02 Nov 2026|240563|-6363|47442|449|31191|-3246|31742|-1237|61113|1175|6470|0|264390|-10800|18965|-772|3110836|280875|7678|280|685292|77899|1148045|99033|3147206|299384|903|580|889537|41332|914204|116790|4012869|452921|113946|930|1275906|48265|1302132|48664|4594495|468210|603|480|731293|19339|1378462|62751|3244365|-47486|273792|17111|3621466|43908|729977|-17220|234295|11910|4597154|-9561|2633389|-26122|404762|20086|1437528|20694|1158|520|187967|37725|917171|84804|961078|34849|277938|40673|254573|21491|1050235|46730|854715|116861|43125|-453|256869|33907|840547|12345|915820|20676|24013|2750|177765|38324|877658|100910
30 Oct 2026|246926|-5679|46993|-138|34437|-1249|32979|5934|59938|225|6470|0|275190|1481|19737|-2838|2829961|262577|7398|4010|607393|5639|1049012|-4448|2847822|197961|323|-242|848205|22958|797414|47101|3559948|446174|113016|5547|1227641|121506|1253468|205124|4126285|535257|123|-442|711954|60777|1315711|182759|3291851|-3826|256681|-379|3577558|-4678|747197|-9830|222385|9898|4606715|-41317|2659511|-2482|384676|15188|1416834|183508|638|84|150242|19690|832367|66093|926229|100477|237265|28368|233082|37290|1003505|103240|737854|58768|43578|365|222962|33523|828202|51787|895144|68484|21263|1316|139441|16832|776748|57811
29 Oct 2026|252605|-8050|47131|-467|35686|-122|27045|1658|59713|2078|6470|60|273709|2859|22575|-11978|2567384|50045|3388|207|601754|77827|1053460|146486|2649861|251532|565|223|825247|-13604|750313|36414|3113774|834528|107469|5128|1106135|133298|1048344|217398|3591028|745700|565|523|651177|173282|1132952|270847|3295677|2498|257060|-11139|3582236|3789|757027|5758|212487|10038|4648032|17034|2661993|-42524|369488|16358|1233326|74755|554|-26|130552|25244|766274|93024|825752|83817|208897|29212|195792|26913|900265|53055|679086|78506|43213|986|189439|25005|776415|50382|826660|55436|19947|2826|122609|24329|718937|72288
28 Oct 2026|260655|8866|47598|-192|35808|2220|25387|90|57635|272|6410|-2000|270850|16205|34553|-3493|2517339|559090|3181|443|523927|123160|906974|207936|2398329|624813|342|342|838851|145009|713899|120466|2279246|654192|102341|280|972837|108062|830946|216080|2845328|591375|42|42|477895|181046|862105|206150|3293179|80016|268199|-1271|3578447|83684|751269|12282|202449|23692|4630998|41232|2704517|74206|353130|35581|1158571|252402|580|290|105308|26162|673250|125500|741935|152047|179685|39525|168879|60130|847210|152652|600580|87026|42227|621|164434|46936|726033|113790|771224|111107|17121|4638|98280|38923|646649|93705
27 Oct 2026|251789|-27305|47790|-1898|33588|-12934|25297|-48156|57363|-14149|8410|-766|254645|-68982|38046|-6396|1958249|-2191105|2738|-7503|400767|-564465|699038|-560473|1773516|-2191574|0|-1836|693842|-518041|593433|-612096|1625054|-2313428|102061|-8504|864775|-509887|614866|-778177|2253953|-2272152|0|-246|296849|-576099|655955|-761498|3213163|-133057|269470|-134523|3494763|-195856|738987|-155172|178757|-81294|4589766|-156093|2630311|-179212|317549|-202009|906169|-1286211|290|-5300|79146|-206232|547750|-673039|589888|-658979|140160|-303981|108749|-343891|694558|-863931|513554|-431982|41606|-22799|117498|-269185|612243|-557107|660117|-396617|12483|-31444|59357|-205443|552944|-647569
26 Oct 2026|279094|1103|49688|-946|46522|9536|73453|3135|71512|8829|9176|-2078|323627|6458|44442|-381|4149354|-240290|10241|-850|965232|3227|1259511|-198367|3965090|-198595|1836|-100|1211883|-30065|1205529|-207519|3938482|993307|110565|17312|1374662|87430|1393043|127603|4526105|691869|246|0|872948|158647|1417453|375136|3346220|-45688|403993|7636|3690619|46413|894159|-8721|260051|-7857|4745859|31589|2809523|-33593|519558|9501|2192380|-265749|5590|438|285378|-23346|1220789|52639|1248867|-63383|444141|6373|452640|-37601|1558489|-141407|945536|34563|64405|634|386683|-53042|1169350|-31779|1056734|-66107|43927|-2882|264800|-18206|1200513|37571
23 Oct 2026|277991|-56|50634|-663|36986|2283|70318|8833|62683|2921|11254|-2273|317169|2166|44823|7583|4389644|468886|11091|1143|962005|153409|1457878|293650|4163685|525230|1936|66|1241948|143003|1413048|248788|2945175|102621|93253|1083|1287232|115545|1265440|167352|3834236|246800|246|166|714301|44774|1042317|94860|3391908|-64685|396357|12197|3644206|-26040|902880|-4560|267908|-26195|4714270|-4768|2843116|-25617|510057|-26508|2458129|-62719|5152|-225|308724|2076|1168150|-1528|1312250|-40852|437768|-2365|490241|-19054|1699896|-125|910973|-47690|63771|8465|439725|2530|1201129|9129|1122841|-37863|46809|-584|283006|-15866|1162942|26747
22 Oct 2026|278047|1469|51297|-211|34703|2105|61485|16105|59762|7115|13527|-10|315003|4777|37240|7586|3920758|173317|9948|630|808596|41685|1164228|-66485|3638455|280932|1870|0|1098945|-9493|1164260|-122292|2842554|496011|92170|-21371|1171687|11980|1098088|164453|3587436|414462|80|-200|669527|107040|947457|129771|3456593|-19468|384160|-902|3670246|9975|907440|-39905|294103|-27310|4719038|29779|2868733|-9988|536565|-42781|2520848|-61610|5377|-201|306648|8933|1169678|19596|1353102|-11506|440133|-2036|509295|-11514|1700021|-8226|958663|-3360|55306|7812|437195|-7574|1192000|21473|1160704|-22252|47393|418|298872|14345|1136195|25840
21 Oct 2026|276578|-4819|51508|-77|32598|-4063|45380|1273|52647|2041|13537|-1194|310226|-6365|29654|-2168|3747441|1141372|9318|-350|766911|209550|1230713|374391|3357523|943932|1870|-185|1108438|298416|1286552|482799|2346543|406790|113541|15735|1159707|148216|933635|238049|3172974|505798|280|-175|562487|124493|817686|178676|3476061|-19204|385062|14231|3660271|46842|947345|43489|321413|19452|4689259|660|2878721|2773|579346|62473|2582458|43176|5578|153|297715|-5541|1150082|19095|1364608|-14693|442169|-1886|520809|8063|1708247|65399|962023|-46393|47494|-144|444769|12929|1170527|31028|1182956|-31450|46975|-251|284527|-3889|1110355|33010
19 Oct 2026|281397|4779|51585|82|36661|-3305|44107|-1781|50606|-6098|14731|421|316591|3626|31822|1826|2606069|-1217512|9668|-907|557361|-150166|856322|-367104|2413591|-1353465|2055|155|810022|-171180|803753|-211198|1939753|-2251398|97806|7925|1011491|-306805|695586|-551692|2667176|-2015461|455|455|437994|-359065|639010|-727899|3495265|41616|370831|18266|3613429|-3319|903856|29079|301961|7098|4688599|8437|2875948|35864|516873|34243|2539282|142557|5425|200|303256|-7080|1130987|11913|1379301|14165|444055|15802|512746|44750|1642848|72873|1008416|-55662|47638|328|431840|17183|1139499|36216|1214406|9069|47226|3099|288416|-2031|1077345|-12072
16 Oct 2026|276618|2253|51503|752|39966|1417|45888|-5127|56704|1651|14310|0|312965|-5411|29996|3055|3823581|900722|10575|-10430|707527|23506|1223426|171587|3767056|902110|1900|0|981202|89300|1014951|93975|4191151|625270|89881|8220|1318296|61927|1247278|-14153|4682637|644715|0|0|797059|-12283|1366909|48831|3453649|22923|352565|26287|3616748|9346|874777|21955|294863|43207|4680162|-22670|2840084|19243|482630|40731|2396725|130579|5225|100|310336|17279|1119074|23023|1365136|42679|428253|19024|467996|25349|1569975|83929|1064078|83125|47310|1070|414657|25819|1103283|15199|1205337|49067|44127|1634|290447|20980|1089417|53532
15 Oct 2026|274365|-22453|50751|1768|38549|4267|51015|-3670|55053|3593|14310|-4651|318376|-12603|26941|-6427|2922859|-248261|21005|-79118|684021|8264|1051839|-4402|2864946|-118753|1900|160|891902|-116761|920976|-88164|3565881|1076630|81661|5711|1256369|160469|1261431|364435|4037922|842170|0|0|809342|258207|1318078|506868|3430726|-12222|326278|14795|3607402|12856|852822|9022|251656|30783|4702832|-5732|2820841|-29719|441899|29119|2266146|-39331|5125|-7195|293057|34243|1096051|66328|1322457|4593|409229|28913|442647|17846|1486046|2693|980953|54952|46240|90|388838|16767|1088084|10521|1156270|11871|42493|663|269467|30462|1035885|39334
14 Oct 2026|296818|7731|48983|152|34282|-1134|54685|-2982|51460|-7770|18961|4661|330979|6068|33368|808|3171120|902620|100123|3490|675757|169250|1056241|184722|2983699|826651|1740|-45|1008663|213161|1009140|220316|2489251|189598|75950|1585|1095900|67183|896996|47218|3195752|309264|0|0|551135|87756|811210|-91436|3442948|25226|311483|13400|3594546|-13876|843800|1495|220873|15760|4708564|-24558|2850560|16158|412780|18885|2305477|158243|12320|75|258814|12450|1029723|-4253|1317864|34226|380316|14059|424801|25953|1483353|92277|926001|19881|46150|603|372071|16925|1077563|30045|1144399|36275|41830|3879|239005|8152|996551|19148
13 Oct 2026|289087|-11981|48831|321|35416|3148|57667|3285|59230|1091|14300|-49|324911|-3217|32560|-3052|2268500|-2656825|96633|5546|506507|-339611|871519|-646874|2157048|-2380246|1785|-1659|795502|-412402|788824|-843457|2299653|-821652|74365|5716|1028717|-129774|849778|-275963|2886488|-967974|0|-1365|463379|-108689|902646|-143645|3417722|-4944|298083|4762|3608422|49077|842305|10680|205113|15151|4733122|71617|2834402|-39365|393895|12172|2147234|-118251|12245|135|246364|36131|1033976|113834|1283638|37490|366257|10579|398848|19465|1391076|-35685|906120|78703|45547|588|355146|16883|1047518|10766|1108124|-1839|37951|1701|230853|29814|977403|77264
12 Oct 2026|301068|9441|48510|414|32268|-2675|54382|-9621|58139|-3965|14349|-1817|328128|-803|35612|4144|4925325|1529245|91087|304|846118|246084|1518393|201034|4537294|1199949|3444|-344|1207904|261052|1632281|516009|3121305|-297569|68649|5725|1158491|-86673|1125741|-168760|3854462|-195413|1365|-87|572068|-132604|1046291|-219173|3422666|19747|293321|3855|3559345|16482|831625|-2043|189962|4614|4661505|15400|2873767|6372|381723|11655|2265485|160879|12110|0|210233|12804|920142|3589|1246148|40103|355678|6011|379383|31753|1426761|99405|827417|4550|44959|1268|338263|21893|1036752|25543|1109963|27974|36250|2032|201039|14322|900139|8926
09 Oct 2026|291627|-16037|48096|304|34943|3360|64003|10844|62104|1833|16166|4624|328931|-9761|31468|1775|3396080|-797789|90783|3123|600034|-137125|1317359|-47786|3337345|-446493|3788|1027|946852|-194585|1116272|-339525|3418874|965687|62924|5640|1245164|122321|1294501|211168|4049875|770069|1452|552|704672|247912|1265464|286283|3402919|-27093|289466|5330|3542863|37869|833668|7635|185348|8466|4646105|39252|2867395|-27753|370068|3776|2104606|-55609|12110|1251|197429|27855|916553|88256|1206045|60775|349667|13629|347630|17578|1327356|-30229|822867|93085|43691|146|316370|10457|1011209|16331|1081989|13380|34218|1439|186717|31625|891213|73575
08 Oct 2026|307664|4595|47792|-182|31583|-1843|53159|-478|60271|2602|11542|-2513|338692|6981|29693|-4978|4193869|1184767|87660|23761|737159|230429|1365145|265265|3783838|1017362|2761|305|1141437|234628|1455797|451928|2453187|214358|57284|2093|1122843|132428|1083333|214825|3279806|326097|900|400|456760|41010|979181|196197|3430012|-22876|284136|7073|3504994|39303|826033|21776|176882|-22|4606853|26848|2895148|10159|366292|8291|2160215|225816|10859|732|169574|6832|828297|21446|1145270|55291|336038|28353|330052|32745|1357585|138437|729782|-6163|43545|0|305913|28576|994878|52549|1068609|30345|32779|2105|155092|11783|817638|30729
07 Oct 2026|303069|5721|47974|1|33426|3141|53637|1035|57669|-2579|14055|-17|331711|7701|34671|4793|3009102|761996|63899|33722|506730|113286|1099880|252495|2766476|725877|2456|50|906809|165881|1003869|269691|2238829|322550|55191|1150|990415|63743|868508|155323|2953709|379673|500|0|415750|56844|782984|106249|3452888|41224|277063|8779|3465691|23645|804257|5186|176904|5466|4580005|-2501|2884989|53440|358001|22429|1934399|217694|10127|1537|162742|10395|806851|17480|1089979|59619|307685|43785|297307|37571|1219148|106131|735945|22811|43545|0|277337|19084|942329|62832|1038264|76652|30674|1791|143309|16316|786909|9968
06 Oct 2026|297348|-4339|47973|273|30285|1168|52602|-1907|60248|594|14072|-800|324010|-7498|29878|2899|2247106|-1784356|30177|2834|393444|-223082|847385|-550365|2040599|-1871601|2406|-1051|740928|-241329|734178|-440988|1916279|-1364022|54041|-150|926672|-248566|713185|-404592|2574036|-1341362|500|-376|358906|-228017|676735|-447575|3411664|-5752|268284|5264|3442046|21621|799071|-14287|171438|11496|4582506|6551|2831549|-21888|335572|10687|1716705|23278|8590|700|152347|22848|789371|69562|1030360|55825|263900|27443|259736|22126|1113017|10994|713134|59750|43545|62|258253|13093|879497|21068|961612|31668|28883|4783|126993|21932|776941|35590
15 May 2026|259336|-2095|71251|24|35826|752|67970|-1460|100614|4681|39277|241|252333|-8352|42159|651|2921368|412605|1819|-5|532822|108772|1249664|280912|2858972|505350|1398|263|789341|133243|1055962|163428|2446899|85747|53854|1846|904311|39567|1173138|117271|3130948|212680|600|-30|513070|27955|933583|3826|3088919|-9278|343106|7520|4149099|13657|993695|-1967|285062|4180|4239629|-39483|3506968|24867|543160|20368|2615488|74099|738|0|218916|20870|1192019|5760|1386675|13134|420505|10699|348988|13817|1870993|63079|819486|1117|31221|-1975|280769|19913|1145938|21082|1066728|21756|8554|515|217394|17638|984738|228
14 May 2026|261431|-10610|71227|208|35074|2203|69430|-3305|95933|-2289|39036|4000|260685|-10060|41508|-3155|2508763|-102438|1824|50|424050|-4217|968752|89360|2353622|67248|1135|-15|656098|-26181|892534|-58296|2361152|586048|52008|1705|864744|32151|1055867|165216|2918268|508341|630|-5|485115|96570|929757|180214|3098197|5742|335586|8718|4135442|31731|995662|12870|280882|2730|4279112|-25528|3482101|49866|522792|31993|2541389|11156|738|36|198046|14721|1186259|39328|1373541|28964|409806|14811|335171|28560|1807914|-7094|818369|50003|33196|328|260856|6668|1124856|16271|1044972|13451|8039|624|199756|21321|984510|37874
13 May 2026|272041|-2195|71019|65|32871|-892|72735|2282|98222|2335|35036|-100|270745|-162|44663|-2813|2611201|322857|1774|260|428267|54976|879392|174437|2286374|431869|1150|290|682279|58985|950830|61386|1775104|428515|50303|1900|832593|20463|890651|93854|2409927|353250|635|35|388545|52364|749543|139083|3092455|16856|326868|15085|4103711|36099|982792|18851|278152|16321|4304640|34738|3432235|8979|490799|26853|2530233|59282|702|7|183325|16511|1146931|34359|1344577|34564|394995|20134|306611|19745|1815008|35716|768366|64157|32868|1667|254188|18956|1108585|1047|1031521|11264|7415|962|178435|11111|946636|62490
12 May 2026|274236|25970|70954|-2058|33763|389|70453|4852|95887|4881|35136|43|270907|16564|47476|7665|2288344|-1521615|1514|80|373291|-150434|704955|-646449|1854505|-1626647|860|-197|623294|-199188|889444|-492388|1346589|-911717|48403|-7699|812130|-47126|796797|-383207|2056677|-919047|600|246|336181|-110480|610460|-320470|3075599|-13288|311783|13649|4067612|25835|963941|40580|261831|666|4269902|3309|3423256|40134|463946|22667|2470951|157452|695|459|166814|3015|1112572|25775|1310013|38957|374861|44509|286866|26862|1779292|76373|704209|-26015|31201|40|235232|28967|1107538|16950|1020257|4751|6453|29|167324|4551|884146|10611
11 May 2026|248266|11937|73012|-1887|33374|-1242|65601|6525|91006|4586|35093|-460|254343|9615|39811|1592|3809959|853021|1434|0|523725|51184|1351404|272323|3481152|714910|1057|325|822482|99807|1381832|361488|2258306|117631|56102|-1700|859256|42217|1180004|19814|2975724|91549|354|0|446661|15575|930930|70840|3088887|15158|298134|-986|4041777|-444|923361|26761|261165|110|4266593|17434|3383122|23784|441279|-839|2313499|227709|236|11|163799|6512|1086797|23649|1271056|56295|330352|22486|260004|26047|1702919|153053|730224|-479|31161|179|206265|24297|1090588|26896|1015506|28127|6424|45|162773|9018|873535|13703
08 May 2026|236329|12489|74899|-442|34616|-2561|59076|959|86420|2725|35553|-2648|244728|11603|38219|-1235|2956938|445062|1434|0|472541|116083|1079081|141454|2766242|395631|732|30|722675|109317|1020344|197619|2140675|75645|57802|-1290|817039|35896|1160190|10009|2884175|98160|354|296|431086|28129|860090|-6326|3073729|47662|299120|-4603|4042221|-32166|896600|29380|261055|861|4249159|9439|3359338|26861|442118|3112|2085790|221184|225|0|157287|11319|1063148|66955|1214761|80020|307866|25413|233957|19581|1549866|174444|730703|30403|30982|0|181968|12578|1063692|70315|987379|58424|6379|205|153755|12553|859832|42114
07 May 2026|223840|10114|75341|-53|37177|1427|58117|-2642|83695|289|38201|-1200|233125|2780|39454|6977|2511876|470109|1434|0|356458|-12353|937627|94320|2370611|360533|702|0|613358|54127|822725|137416|2065030|155347|59092|-7200|781143|29376|1150181|122457|2786015|299594|58|0|402957|7593|866416|-7208|3026067|61276|303723|8013|4074387|-11673|867220|118|260194|15825|4239720|-22677|3332477|45457|439006|19129|1864606|132043|225|0|145968|16515|996193|32826|1134741|51092|282453|17412|214376|14658|1375422|98222|700300|52804|30982|540|169390|12285|993377|39046|928955|54313|6174|657|141202|14051|817718|35654
06 May 2026|213726|-8553|75394|58|35750|6151|60759|11249|83406|2831|39401|-582|230345|2613|32477|4043|2041767|196012|1434|484|368811|79555|843307|199336|2010078|379359|702|270|559231|62491|685309|33267|1909683|584379|66292|490|751767|60966|1027724|220980|2486421|516791|58|56|395364|86854|873624|263115|2964791|23765|295710|14357|4086060|26534|867102|20828|244369|-3389|4262397|46803|3287020|18766|419877|23304|1732563|12750|225|56|129453|25970|963367|109906|1083649|74546|265041|40945|199718|23938|1277200|9253|647496|50334|30442|1464|157105|22297|954331|36912|874642|25975|5517|1070|127151|25995|782064|57967
05 May 2026|222279|6368|75336|15|29599|291|49510|5244|80575|3186|39983|3270|227732|5852|28434|-390|1845755|-1478550|950|0|289256|-274449|643971|-580097|1630719|-1479497|432|-577|496740|-253531|652042|-599491|1325304|-802082|65802|-2928|690801|-112181|806744|-328857|1969630|-812792|2|-600|308510|-143240|610509|-289417|2941026|40416|281353|5457|4059526|15081|846274|14594|247758|8090|4215594|21260|3268254|29647|396573|16551|1719813|129725|169|0|103483|9279|853461|69784|1009103|77663|224096|45593|175780|17742|1267947|67790|597162|32889|28978|1057|134808|10602|917419|41455|848667|44028|4447|1039|101156|7886|724097|33050
04 May 2026|215911|10120|75321|151|29308|1802|44266|1382|77389|1756|36713|-50|221880|9898|28824|1851|3324305|994843|950|-1048|563705|211933|1224068|358769|3110216|907568|1009|-32|750271|178161|1251533|478801|2127386|456149|68730|9250|802982|87342|1135601|126810|2782422|393823|602|0|451750|95475|899926|190254|2900610|51338|275896|2258|4044445|22465|831680|27114|239668|10502|4194334|39515|3238607|15433|380022|37725|1590088|196415|169|0|94204|14726|783677|105695|931440|117878|178503|62896|158038|28254|1200157|107808|564273|67211|27921|225|124206|14841|875964|54141|804639|47753|3408|977|93270|16688|691047|71000
FII DII Data Today
Latest NSE provisional data, in ₹ crore
| Date | FII Net | DII Net |
|---|
 Zerodha
FII & DII Data Dashboard
F&O Activity
Track daily FII and DII F&O trading activity to understand smart money trends.
Cash Summary
Daily summaries of FII and DII cash market activity, updated after market close.
Options Activity
Daily FII options data to analyze smart money trends.
Participant OI
Track daily derivative positions of market participants like FIIs, DIIs.
Free FII DII Tools and Research
About FIIAndDIIData.com
FIIAndDIIData.com is a free FII and DII data website. Every trading day after market close we publish the FII DII cash market daily summary, FII DII F&O activity, the FII options data tracker and the full NSE participant wise open interest table, all from official NSE data. It is a quick way to check the latest FII DII activity in the Indian stock market after each session, and the FII DII data history page shows how these flows have changed over the years.
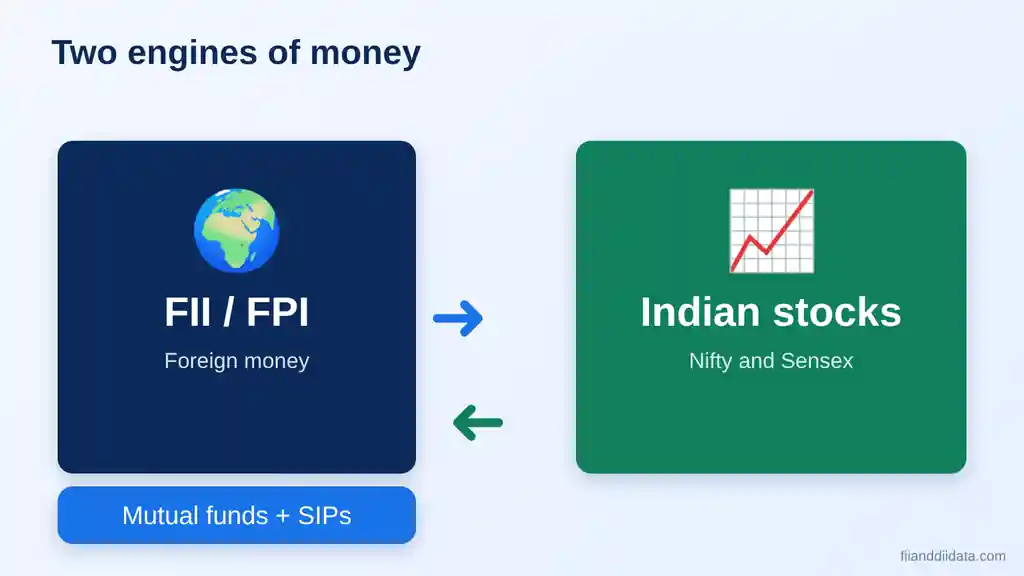
FIIs (Foreign Institutional Investors, now called FPIs) and DIIs (Domestic Institutional Investors such as mutual funds and LIC) move thousands of crores every day. When both buy, the market usually has strong support; when FIIs sell heavily, DIIs often absorb the supply. Tracking their daily flows helps you understand the trend before it shows up on the chart. New to this? Start with what is FII and DII data and the difference between FII and DII.
How to Read FII and DII Data
FII and DII data gives you two key numbers every trading day: the FII net figure and the DII net figure in the cash market. Net means gross buying minus gross selling. A positive number shows net buying and a negative number shows net selling. NSE releases the provisional figures around 6 PM IST, and NSDL publishes final FPI data on the next working day. Read the two numbers together, not alone:
| FII cash | DII cash | What it usually means |
|---|---|---|
| Net buyer | Net buyer | Strong institutional support; the trend is usually firm. |
| Net seller | Net buyer | DIIs absorb foreign selling; if DII buying is larger, the index often holds up. |
| Net buyer | Net seller | Foreign money leads; DIIs may be booking profits or meeting redemptions. |
| Net seller | Net seller | Both groups are selling; the market usually comes under pressure. |
Example: if FIIs are net sellers of ₹2,000 crore and DIIs are net buyers of ₹2,600 crore on the same day, domestic institutions have absorbed all the foreign selling with ₹600 crore to spare. Check the FII DII F&O data as well to see whether FIIs are hedging in index futures and options, and use the FII DII monthly data to see the bigger trend. Our step-by-step guide on how to check FII DII data covers NSE, NSDL and apps.
Latest FII DII Data Analysis
Swipe left or right to see more reports.




Read every report and guide on the FII and DII data blog.
FII DII Data: Frequently Asked Questions
What is FII and DII data?
It is the daily record of how much Foreign Institutional Investors and Domestic Institutional Investors bought and sold in Indian stocks and derivatives. NSE publishes it after market close every trading day.
Where can I find FII DII data today?
FIIAndDIIData.com shows the latest FII and DII cash market figures, F&O activity, FII options data and participant wise open interest for free, updated every trading day.
What time is FII DII data released?
NSE usually releases provisional FII and DII cash market figures around 6 PM IST. The participant wise open interest report comes later in the evening. Our tables are updated the same night.
Is FII DII data available live during market hours?
No. Exchanges do not publish FII and DII buying and selling during the trading session. The first figures for the day are NSE’s provisional numbers released in the evening, and NSDL’s final FPI data follows on the next working day. Any site showing live intraday FII DII figures is estimating, not reporting official data.
Can I see past FII and DII data?
Yes. The cash market table has daily history since May 2026, and the F&O, options and participant OI tables let you pick earlier dates.
How does FII selling affect the Nifty?
Heavy FII selling often puts pressure on the Nifty, especially large caps. Strong DII buying can cushion the fall, so it helps to look at both numbers together and at the trend over several days.
Get FII DII Data Alerts by Email
Free. Get our daily FII DII analysis, weekly report and monthly report in your inbox. No spam, unsubscribe anytime.
Disclaimer: FIIAndDIIData.com is not registered with SEBI as an investment adviser. All content is for educational purposes only and is not investment advice.