Table of Contents
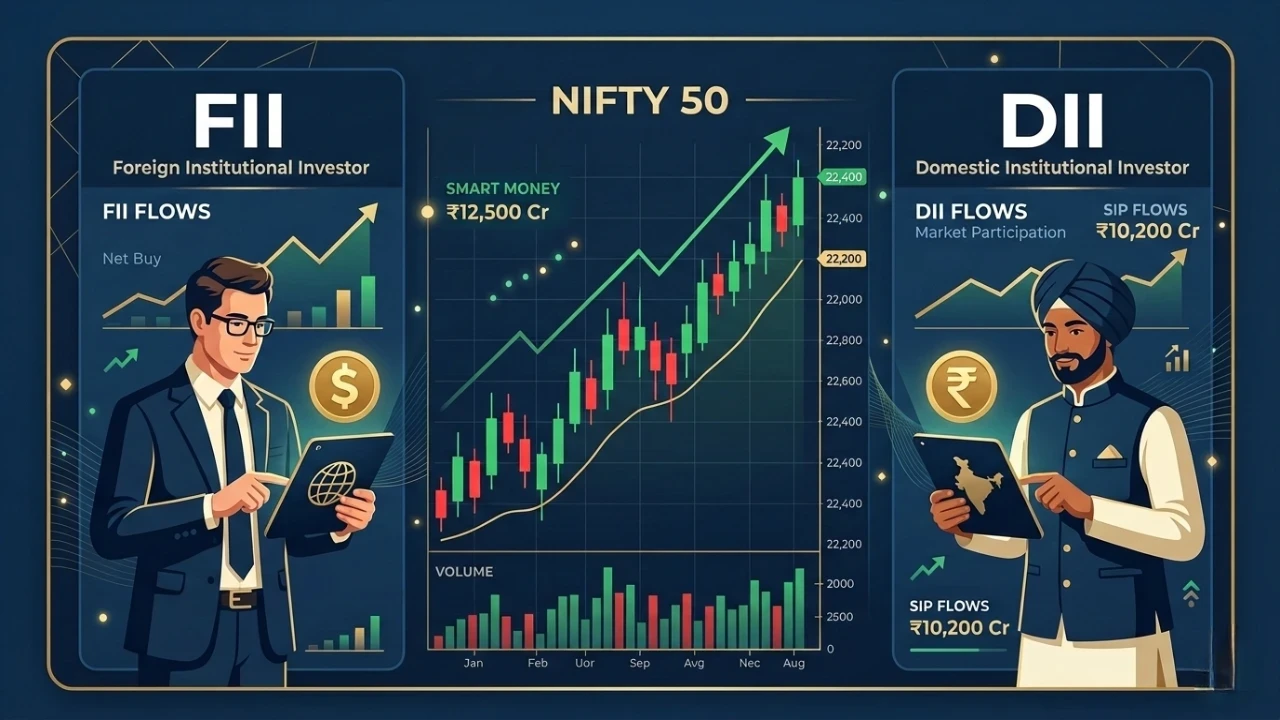
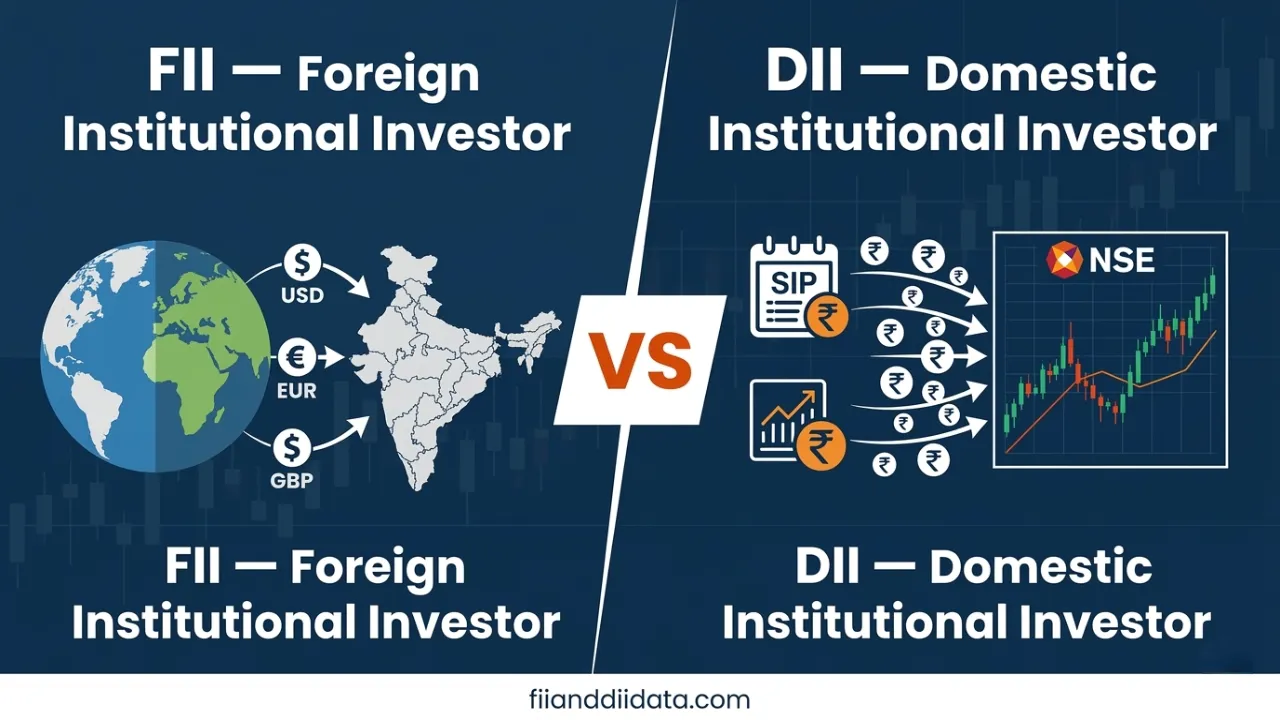
FII (Foreign Institutional Investors) are overseas entities like hedge funds and pension funds that invest in Indian markets. DII (Domestic Institutional Investors) are Indian institutions like mutual funds, LIC, and banks. The key difference: FIIs bring foreign capital and often drive volatility, while DIIs use domestic savings and typically provide market stability. Both groups are tracked as smart money because their large capital moves influence market direction.
If you have ever watched a financial news channel in India, you have heard the anchor say FIIs were net sellers today or DIIs provided support at lower levels. But what exactly do FII and DII mean? And more importantly, why should a retail trader care about the difference? In this comprehensive guide, we will break down the complete difference between FII and DII who they are, how they invest, how they impact the Nifty 50, and how you can use their daily activity data to make smarter trading and investment decisions.You can track live FII and DII activity every day on the FII DII Data Dashboard fiianddiidata.com the most focused platform for institutional flow data in India.
Who Are FIIs? (Foreign Institutional Investors)

current regulatory framework are investment entities registered outside India that invest in Indian financial markets. Think of them as large pools of global money that enter and exit Indian stocks and bonds based on global macroeconomic conditions.
Examples of FIIs investing in India:
- US-based hedge funds (e.g. Blackrock, Vanguard, Fidelity)
- Sovereign wealth funds (e.g. Government of Singapore Investment Corporation)
- Foreign pension funds and insurance companies
- International mutual funds with India-focused mandates
- Foreign banks and investment banks with India exposure
FIIs are regulated by SEBI under the Foreign Portfolio Investors (FPI) Regulations. They must register with SEBI and follow strict investment limits in various sectors. As of 2026 FIIs hold approximately 18-22% of the total market cap of NSE-listed companies making them the single most influential external force on Indian markets.
Key FII Fact
FIIs can move thousands of crores in a single trading day. When FIIs sell heavily as seen during the October–November 2024 selloff when FIIs sold over ₹1.14 lakh crore in a single month markets can fall sharply even if domestic fundamentals are strong.
Who Are DIIs? (Domestic Institutional Investors)

Domestic Institutional Investors (DIIs) are Indian-based institutions that invest in the stock market using pooled domestic savings. These are entities managing money on behalf of millions of ordinary Indians through mutual fund SIPs, insurance premiums, and provident fund contributions.
Examples of DIIs in India:
- Mutual Fund Companies (SBI MF, HDFC MF, ICICI Prudential MF, etc.)
- Life Insurance Corporation of India (LIC) the single largest DII
- General Insurance Companies (New India Assurance, Oriental Insurance)
- Domestic pension funds (EPFO, NPS)
- Domestic banks and financial institutions investing their own capital
The rise of SIP (Systematic Investment Plan) culture in India has dramatically strengthened DII buying power. In 2024, monthly SIP inflows crossed ₹25,000 crore meaning DIIs have a predictable and growing pool of capital to deploy in markets every month, regardless of global conditions.
FII vs DII: Complete Comparison Table
Here is a side-by-side comparison of every major difference between FII and DII:
| Factor | FII (Foreign Institutional Investors) | DII (Domestic Institutional Investors) |
| Full Form | Foreign Institutional Investors (also called FPI) | Domestic Institutional Investors |
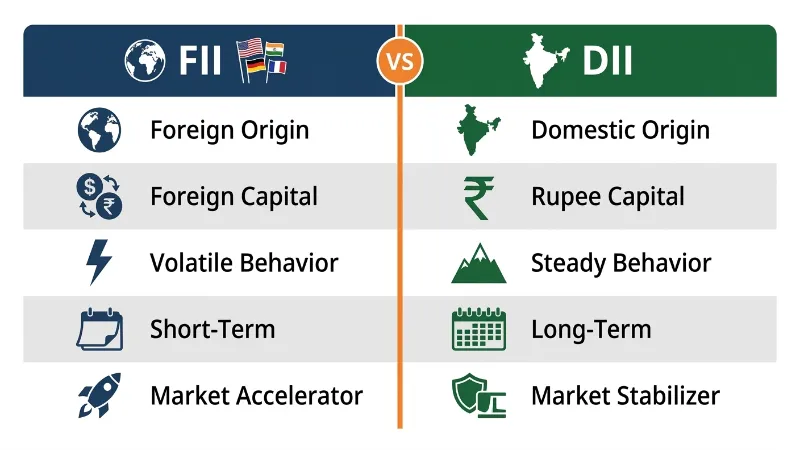
| Origin | Based outside India (USA, UK, Singapore, etc.) | Based inside India |
| Main Examples | Hedge funds, foreign pension funds, global MFs | Indian mutual funds, LIC, EPFO, banks |
| Capital Source | Foreign money (USD, EUR, GBP, etc.) | Domestic savings (SIPs, premiums, deposits) |
| Regulator | SEBI FPI Regulations | SEBI, IRDAI, PFRDA (depending on type) |
| Market Impact | HIGH can trigger major rallies or corrections | STABILIZING acts as cushion during FII sell-offs |
| Investment Style | Short to medium term, trend-following, macro-driven | Long-term, value-driven, contrarian buyers |
| Behaviour Pattern | Sell India when global risk-off; buy when risk-on | Buy consistently every month due to SIP inflows |
| Currency Risk | YES affected by INR/USD exchange rate | NO invests in INR only |
| Volatility Impact | INCREASES market volatility | REDUCES market volatility |
| Data Available | Daily: Cash + F&O + Options + OI data on NSE | Daily Cash + F&O data on NSE |
| Sector Focus (2026) | IT, Banking, Consumer (varies with global theme) | Banking, PSU, Infrastructure (India growth story) |
| Influence on Nifty | Single largest driver of Nifty direction | Acts as floor support prevents excessive falls |

How FII and DII Activity Impacts the Indian Stock Market
FII Impact: The Accelerator
FIIs are the primary drivers of large market moves in India. When global conditions are favourable such as a US Fed rate cut strong global risk appetite or India-specific upgrades (e.g. MSCI weightage increase) FIIs pour money into Indian markets, pushing indices sharply higher.
Conversely, when global risks rise US recession fears, dollar strengthening, geopolitical tensions FIIs exit India rapidly. This is why Indian markets often fall even when domestic economic data is positive. FII activity is influenced by global factors that have nothing to do with India’s fundamentals.
Real Example FII Selling Wave (Oct–Nov 2024)
FIIs sold ₹1,13,858 crore worth of Indian equities in October 2024 alone the largest monthly selloff in history at that time. The Nifty fell approximately 8% from its highs during this period. Despite strong Indian GDP growth data, the selling was driven by: strengthening US Dollar fears of Donald Trump’s tariff policies, and FIIs shifting money to China after its stimulus announcement. This is a perfect example of how FII activity is macro-driven, not India-specific.
DII Impact: The Stabilizer
DIIs have emerged as a powerful counterforce to FII selling over the past 5 years. Thanks to the explosion of SIP culture in India DIIs receive a steady and growing inflow of ₹20,000–₹25,000+ crore every month. This gives them dry powder to deploy when FIIs sell preventing markets from collapsing.
The relationship is often described as a tug of war: when FIIs sell, DIIs buy. This dynamic has changed Indian market behaviour significantly corrections are shorter and shallower than they used to be in the pre-DII-dominance era (pre-2017).
- Bullish Signal: Both FIIs AND DIIs net buying simultaneously very strong market rally likely
- Neutral Signal: FIIs selling but DIIs buying market likely to stay range-bound or fall slowly
- Bearish Signal: Both FIIs AND DIIs net selling significant correction likely
- Watch Carefully: FIIs buying but DIIs selling unusual often precedes a reversal
How to Use FII and DII Data for Trading Decisions
Understanding the theory is step one. Here is how to practically apply FII and DII data in your daily trading:
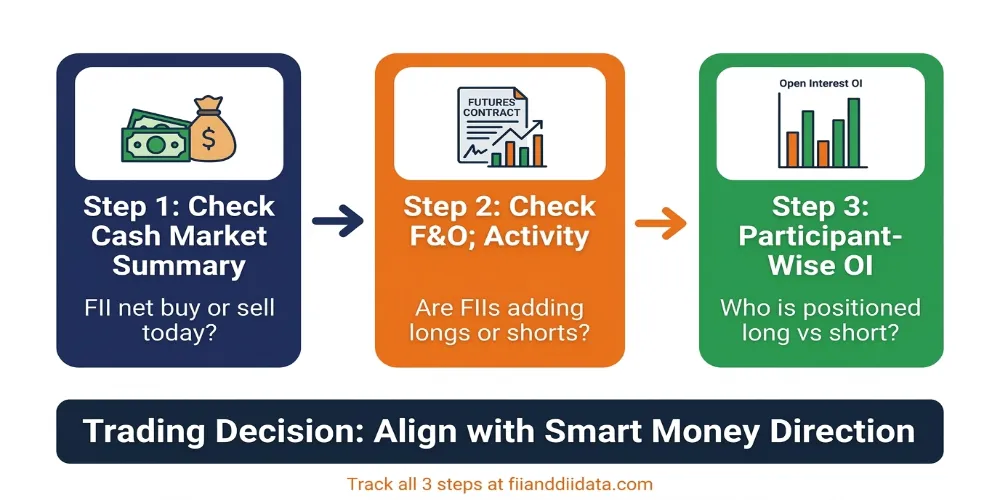
Step 1: Check the Daily Cash Market Summary
Every day after 8:00 PM IST, NSE releases official FII and DII cash market data. Visit the Cash Market Summary on fiianddiidata.com to see the net buy/sell figures. If FIIs are net buyers for 3-5 consecutive days it signals building institutional conviction.
Step 2: Cross-Reference with F&O Activity
Cash market data alone is incomplete. Check the FII F&O Activity data to see if FIIs are adding long or short positions in index futures. A combination of cash buying + futures long addition = very bullish signal.
Step 3: Analyse Participant-Wise Open Interest
The most powerful tool is the NSE Participant-Wise OI data. This shows the long-vs-short ratio of FIIs, DIIs, Pro desks, and retail clients in index futures. When FIIs are heavily long and retail is heavily short the market almost always goes up.
Pro Strategy: The FII-Retail Divergence Trade
Watch the Participant-Wise OI every Thursday (expiry day) If FIIs are net long in index futures while retail clients (Clients category) are net short this divergence historically resolves in FIIs favour. The market tends to rally into expiry squeezing retail shorts. This is one of the most reliable signals in the Indian F&O market.
Key Behavioral Differences: FII vs DII What the Data Shows
FII Behaviour Patterns
- Trend-following: FIIs tend to buy when markets are rising and sell when falling amplifying moves
- Macro-sensitive: US Fed policy, dollar index, global risk sentiment drive FII flows more than India-specific factors
- Sector rotation: FIIs rotate between sectors faster than DIIs based on global themes (e.g. moved from IT to PSU banks in 2022-23)
- MSCI-driven: Every MSCI India rebalancing (quarterly) triggers large, predictable FII flows that can be traded
- Currency-sensitive: When INR depreciates vs USD FII returns in dollar terms are reduced prompting selling
DII Behaviour Patterns
- Contrarian buyers: DIIs systematically buy more when markets fall (averaging down strategy)
- SIP-driven consistency: Monthly SIP inflows create a baseline of ₹20,000+ crore in monthly buying regardless of market conditions
- Long-term holders: DIIs rarely exit positions quickly they build long-term portfolios aligned with India’s growth story
- PSU and banking focus: DIIs in 2024-25 have been consistently overweight on PSU stocks, infrastructure, and banking
- Less F&O active: Unlike FIIs, DIIs are predominantly cash market participants their F&O footprint is smaller
Sample FII vs DII Data: How to Read the Numbers
Here is an example of what FII and DII daily data looks like and how to interpret it.
| Date | FII Net (₹ Crore) | DII Net (₹ Crore) | Market Sentiment |
| 16 March | -9,366 | +12,593 | Cautious FII selling, DII absorbing |
| 13 March | -10717 | +9,977 | Neutral DII offsetting FII selling |
| 12 March | -7,050 | +7,450 | FII Sell and DII Buy |
| 11 March | -6267 | +4,966 | Bullish FII-led rally |
| 10 March | –4673 | +6,333 | Bearish pressure Heavy FII selling |
Source: NSE India Official Data | Live data available at fiianddiidata.com
Common Mistakes Traders Make With FII/DII Data
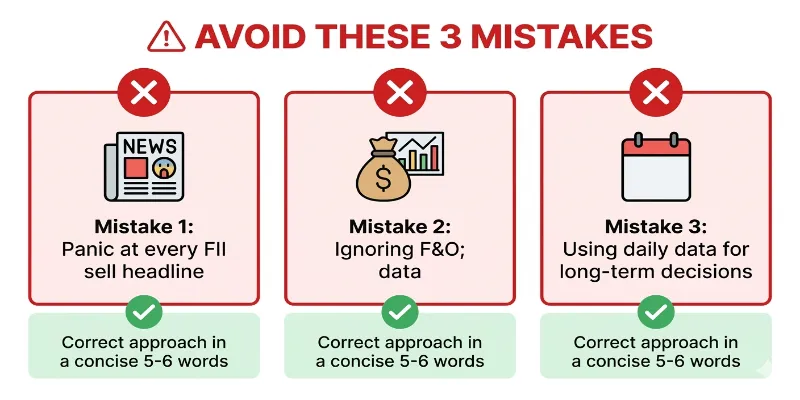
- Mistake 1: Reacting to one day’s data: One day of FII selling does not make a trend. Look for at least 5–7 consecutive trading days of consistent buying or selling before drawing conclusions.
- Mistake 2: Ignoring F&O data: Cash market data alone is incomplete. An FII can sell in cash but buy heavily in futures net effect is bullish. Always combine cash + F&O data.
- Mistake 3: Assuming DII buying = market will rise: If FII selling is significantly larger than DII buying in rupee terms markets will still fall. Size of flows matters not just direction.
- Mistake 4: Not considering currency: A weakening rupee reduces FII returns in dollar terms triggering more selling even if Indian fundamentals are good. Always watch USD/INR alongside FII data.
- Mistake 5: Ignoring OI data: Open Interest changes tell you whether institutions are adding or unwinding positions which is more valuable than just the buy/sell figure for short-term trading.
Frequently Asked Questions (FAQs)
What is the main difference between FII and DII?
The main difference is their origin and capital source. FIIs are foreign entities investing foreign capital in India they are volatile and macro-driven. DIIs are Indian institutions investing domestic savings they are stable and contrarian. FIIs tend to increase market volatility while DIIs reduce it.
Which is more powerful FII or DII?
In terms of single-day impact FIIs are more powerful because they can move ₹3,000-₹10,000 crore in a single session. However over the long term DIIs have become increasingly powerful due to consistent SIP inflows. In 2024 DII buying actually exceeded FII selling for several months proving their growing muscle.
Is FII buying good for the stock market?
Yes FII buying is generally a positive signal. It indicates that global investors have confidence in India’s growth story. Sustained FII buying over multiple weeks typically drives a broad-based market rally. However FII money is hot money it can exit quickly when global conditions change.
What happens when FII sells and DII buys?
When FIIs sell and DIIs buy simultaneously the market typically remains range-bound or falls slowly. The DII buying acts as a floor preventing a sharp crash. This is actually a healthy market correction phase prices consolidate while ownership transfers from foreign hands to domestic long-term investors.
What is the difference between FII and FPI?
FII (Foreign Institutional Investor) is the older term used before 2014. SEBI replaced the FII category with FPI (Foreign Portfolio Investor) in 2014 under the FPI Regulations. The two terms refer to essentially the same entities foreign entities investing in Indian securities markets. Today, the official regulatory term is FPI but FII is still commonly used in market parlance.
How can I track FII and DII data daily?
NSE India releases official FII and DII data every evening after market close (around 8:30-9:30 PM IST). You can track this data including cash market, F&O activity, options data, and participant-wise OI for free on fiianddiidata.com which provides the most focused FII/DII data dashboard in India.
Conclusion: Use FII and DII Data as Your Market Compass
Understanding the difference between FII and DII is not just academic knowledge it is practical trading intelligence. FIIs tell you what global smart money thinks about India. DIIs tell you what domestic smart money thinks When they agree the signal is powerful. When they diverge the market is in transition.
The most successful retail traders in India do not just rely on chart patterns or fundamental analysis. They integrate institutional flow data as a third layer of confirmation A breakout supported by FII buying is far more reliable than a breakout on retail buying alone. Start tracking FII and DII data every day it takes just 5 minutes. Visit the FII DII Data Dashboard on fiianddiidata.com for live cash market, F&O activity, options data, and participant-wise OI all in one place, updated daily.