Table of Contents
FII and DII data refers to the official daily report of buying and selling activity by Foreign Institutional Investors (FIIs) and Domestic Institutional Investors (DIIs) in the Indian stock market. Released by NSE and BSE after market close this data reveals the direction of Smart Money and is the most reliable indicator of market sentiment available to retail traders completely free.
If you have ever wondered why the Nifty 50 suddenly fell 300 points even when the news seemed positive, the answer is almost always hidden in the FII DII data. These two groups of institutional investors control billions of rupees in the Indian market and where they move their money, the market follows.
In this complete guide, you will understand exactly what FII and DII data means, why it matters for your trades, and how to read it step by step even if you are a complete beginner.
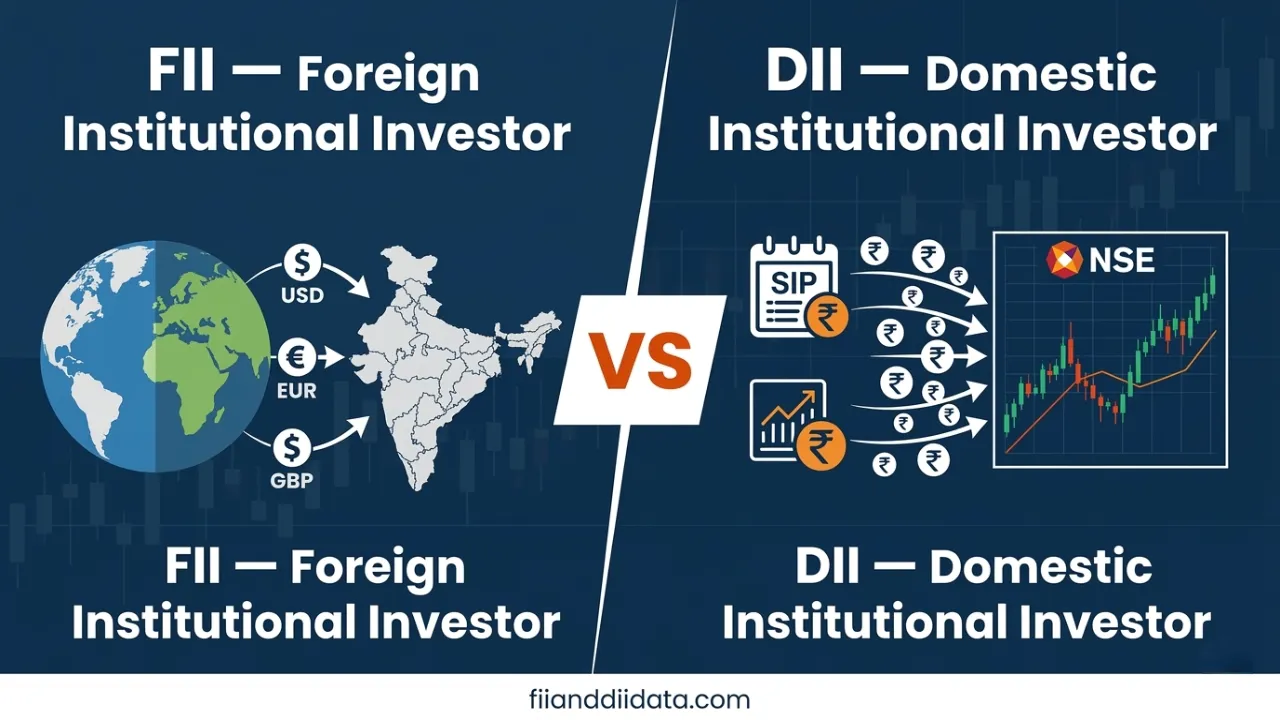
Who Are FIIs? (Foreign Institutional Investors)
Foreign Institutional Investors, commonly called FIIs or FPIs (Foreign Portfolio Investors), are large investment funds based outside India that invest in Indian stocks, bonds, and derivatives. They include:
- Hedge Funds: Global funds that take aggressive long and short positions in Indian equities
- Pension Funds: Massive long-term funds from the US, UK, Europe, and Japan
- Mutual Funds: International asset management companies like Vanguard, BlackRock, Fidelity
- Sovereign Wealth Funds: Government-owned investment funds from countries like Singapore, Norway, UAE
FIIs are often called the primary drivers of volatility in India because they manage trillions of dollars globally and can move enormous amounts of money into or out of India within days. When FIIs sell aggressively even a strong DII cushion cannot prevent a market correction.
Key Fact: As of 2025, FIIs collectively hold approximately 18–22% of the total market capitalization of NSE-listed companies. A 1% shift in their India allocation can move the Nifty by 3–5%.
Who Are DIIs? (Domestic Institutional Investors)
Domestic Institutional Investors are Indian-based institutions that invest in the stock market using pooled money from Indian citizens. The main categories are:
- Mutual Funds (AMCs): HDFC Mutual Fund, SBI Mutual Fund, ICICI Prudential they invest the SIP money of crores of Indian retail investors
- Insurance Companies: LIC (Life Insurance Corporation of India) is the single largest DII and a major market stabilizer
- Banks and NBFCs: Proprietary desks of Indian banks that invest their treasury funds
- Pension Funds: EPFO (Employees‘ Provident Fund Organisation) which invests a portion of PF corpus in equities
DIIs typically act as a counter-balance to FII activity. When FIIs sell heavily, DIIs often step in and buy absorbing the selling pressure and preventing a complete market crash. This is why understanding both together (not separately) gives you the full picture of market health.
FII vs DII Quick Comparison Table
| Factor | FII (Foreign) | DII (Domestic) |
| Full Form | Foreign Institutional Investor | Domestic Institutional Investor |
| Headquarters | Outside India | Inside India |
| Examples | BlackRock, Vanguard, GIC Singapore | LIC, SBI MF, HDFC MF, EPFO |
| Regulated By | SEBI (as FPI) | SEBI |
| Market Role | Primary trend driver | Market stabilizer / cushion |
| When They Buy | Nifty usually rallies strongly | Absorbs FII selling pressure |
| When They Sell | Nifty usually falls sharply | Rare usually counter-buys |
| Data Source | NSE/BSE after market close | NSE/BSE after market close |
| Data Available At | fiianddiidata.com (free) | fiianddiidata.com (free) |
Source: NSE India | Data as of 2026
What Exactly is FII and DII Data?
Every trading day, after the market closes, both NSE (National Stock Exchange) and BSE (Bombay Stock Exchange) officially publish the institutional trading activity data. This data is released between 8:30 PM and 9:30 PM IST and covers two major segments:
1. Cash Market Data
This shows how much money FIIs and DIIs bought and sold in the delivery-based segment meaning actual stock purchases and sales, not derivatives. The key metrics are:
- Gross Purchase: Total value of stocks bought by FIIs or DIIs in crore rupees
- Gross Sales: Total value of stocks sold by FIIs or DIIs in crore rupees
- Net Purchase/Net Sales: Gross Purchase minus Gross Sales. A positive number means net buying; negative means net selling
Example: If FIIs Gross Purchase = Rs. 12,500 crore and Gross Sales = Rs. 14,200 crore, then Net = Rs. -1,700 crore, meaning FIIs were net sellers of Rs. 1,700 crore that day.
F&O (Futures and Options) Data
This shows institutional activity in the derivatives segment. F&O data is more complex but gives short-term signals about market direction. The key metrics include:
- Index Futures: Long and short positions in Nifty and BankNifty futures directly signals which direction FIIs expect the market to move
- Index Options: Whether FIIs are buying or selling Call and Put options reveals their hedging and directional strategy
- Stock Futures: Institutional positions in individual stock futures
Why Does FII DII Data Matter for Retail Traders?
Most retail traders lose money because they react to price they buy after a breakout and sell during a panic FII and DII data lets you see what the smart money is doing before the price fully reflects it. Here are the key advantages:
Advantage 1: Identifying Real Market Sentiment
Price can be manipulated in the short term. Institutional data cannot be faked these are officially reported figures from NSE and BSE. If both FIIs and DIIs are net buyers for 5 consecutive days the market sentiment is genuinely bullish regardless of negative news headlines.
Advantage 2: Confirmation of Breakouts
Imagine Nifty breaks above a key resistance level. Is it a real breakout or a bull trap? If FII data shows they were net buyers on that day with large F&O long positions, the breakout is likely genuine. If FIIs were selling while retail was buying it is almost certainly a trap.
Advantage 3: Early Warning of Corrections
When FIIs start consistently selling for 3 to 5 days even when the market has not fallen much it is an early warning. FIIs have global research teams and information advantages. Their sustained selling often precedes a broader market correction by 1–2 weeks.
Advantage 4: Sector Rotation Intelligence
FII and DII data at the sector level shows which industries are receiving institutional money. If FIIs are heavily buying banking sector stocks for 2 weeks straight BankNifty is likely to outperform. This helps you position in the right sectors early.
Real Scenario: In October 2024, FIIs sold a record Rs. 94,017 crore in a single month. DIIs bought Rs. 97,641 crore absorbing most of the selling. The Nifty fell 6% a manageable correction rather than a crash. Without DII support the fall could have been 15-20%.
Also Read : Track FII long short ratio in NSE Participant OI data
FII and DII Data: Year-wise Annual Performance (2020-2024)
| Year | FII Net Flow | DII Net Flow | Nifty Annual Return | Key Event |
| 2020 | -1,47,987 Cr (Sell) | +1,69,038 Cr (Buy) | +14.9% | COVID crash DIIs absorbed FII selling |
| 2021 | +25,752 Cr (Buy) | -14,547 Cr (Sell) | +24.1% | Post-COVID recovery FIIs returned |
| 2022 | -1,21,439 Cr (Sell) | +2,21,372 Cr (Buy) | +4.3% | US Fed rate hikes FII mass exit |
| 2023 | +1,71,107 Cr (Buy) | +1,06,477 Cr (Buy) | +19.4% | Both FII+DII buying strong bull run |
| 2024 | -12,914 Cr (Sell) | +5,26,832 Cr (Buy) | -8.4% | FII selling absorbed by record DII SIP flows |
How to Read FII DII Data: Step-by-Step
Reading this data correctly is a skill. Here is a simple 4-step framework any trader can use:
Step 1: Check the Net Number
The first thing to check is whether FIIs are net buyers or net sellers in the cash market. A net buy figure is bullish a net sell is bearish. But one day’s data is not enough look at the 5-day trend.
Step 2: Compare FII vs DII Direction
The most powerful signal comes from alignment or divergence between FII and DII activity:
- Both buying (Strongly Bullish): Market is likely to trend up strongly
- FII selling, DII buying (Neutral to Mildly Bearish): DII is cushioning the fall. Market may consolidate or fall slowly
- Both selling (Very Bearish): Rare but devastating. Market is likely to fall sharply. Exit long positions
- FII buying, DII selling (Mildly Bullish): FII momentum may drive market up but DII profit-booking may cap gains
Step 3: Check F&O Data for Short-Term Direction
After checking cash market data look at the Index Futures section. If FIIs are adding long positions in Index Futures while also buying in cash market the signal is very strong. If they are buying cash but shorting futures they may be hedging a sign of uncertainty.
Step 4: Look at Participant-Wise Open Interest
The NSE Participant-Wise OI data breaks down all F&O positions into four groups: FII, DII, Proprietary (Pro) desks, and Retail Clients. The most powerful signal is the FII Long-Short Ratio in Index Futures when this ratio falls below 1.0 (meaning FIIs hold more short positions than longs), a market reversal to the downside is likely within 24–48 hours.
Sample FII DII Data Interpretation Table
| FII Activity | DII Activity | Market Signal | Suggested Action |
| Net Buyer | Net Buyer | Strongly Bullish | Add long positions confidently |
| Net Buyer | Net Seller | Mildly Bullish | Hold positions, watch closely |
| Net Seller | Net Buyer | Neutral / Mild fall | Wait DII cushioning the fall |
| Net Seller | Net Seller | Very Bearish | Exit longs, avoid buying |
| Heavy Sell 5+ days | Heavy Buy | Oversold watch reversal | Watch for FII buying reversal signal |
| Consistent Buy 5d+ | Consistent Buy | Strong Uptrend | Ride the trend with stops |
Also Read F&O Activity: Check daily FII DII F&O; futures and options activity
Where to Find FII DII Data in India
FII and DII data is officially released by NSE and BSE and is publicly available for free. However, the raw data on official exchanges is complex to read. Here are the best sources:
- FIIAndDIIData.com(Recommended): The only dedicated platform that presents all FII DII data Cash Market, F&O Activity, Options Activity, and Participant OI in one clean, easy-to-read dashboard. Updated daily after market close.
- NSE India (nseindia.com): The official source. Data is accurate but navigation is complex. Best used to verify data.
- BSE India (bseindia.com): Similar to NSE but covers BSE-listed stocks.
- SEBI (sebi.gov.in): Publishes monthly FPI data reports with category-wise breakdowns.
5 Common Mistakes Beginners Make with FII DII Data
- Looking at only one day’s data: Never make a trading decision based on a single day’s FII DII numbers. Always look at the 5-day and 10-day trend to identify consistent patterns.
- Ignoring F&O data: Cash market data alone is incomplete. FIIs often hedge in F&O while buying in cash or vice versa. Looking at both together gives the true picture.
- Treating FII selling as automatically bearish: During global risk-off events (US Fed rate hikes geopolitical crises) FIIs sell India as part of a global strategy. This often presents the best buying opportunities for long-term investors.
- Ignoring DII data: Many beginners track only FII data. But DII buying has become increasingly powerful since 2020 as SIP inflows reached Rs. 25,000+ crore per month. DII support can absorb significant FII selling.
- Not checking the time of data release: FII DII data is released after market close usually between 8:30 PM and 9:30 PM IST. Data seen before this time on any platform is estimated or delayed wait for official figures.
🔗 Now that you understand what FII DII data means, take the next step: Track today’s live FII DII Cash Market Summary, F&O Activity, and NSE Participant-Wise Open Interest all on one page at FIIAndDIIData.com
Frequently Asked Questions (FAQs)
These are the most common questions traders have about FII and DII data:
-
What is the difference between FII and FPI?
FII (Foreign Institutional Investor) is the older term used before 2014. SEBI replaced it with FPI (Foreign Portfolio Investor) under the FPI Regulations 2019. In practice, FII and FPI refer to the same category of foreign investors. The terms are used interchangeably in market discussions though FPI is now the official regulatory term.
-
When is FII DII data released every day?
NSE and BSE release official FII DII data after market close, typically between 8:30 PM and 9:30 PM IST on trading days. FIIAndDIIData.com updates its dashboard as soon as the official data is published. Data is not available during market hours.
-
Is FII buying always good for the Indian market?
Generally yes but not always. Large FII inflows can cause currency appreciation (rupee strengthens) which can hurt export-oriented sectors like IT and pharma. However consistent FII buying over weeks signals genuine confidence in India’s economic outlook and is broadly positive for the broader market.
-
What does ‘Net Sell’ by FII mean for my portfolio?
A single day of FII net selling is not alarming it is normal. However if FIIs are net sellers for 10 or more consecutive days with large amounts (above Rs. 3,000-5,000 crore per day) it can signal a broader market correction. In that case, reducing leverage and shifting to defensive stocks (FMCG, pharma, IT) is advisable.
-
How often should I check FII DII data?
For swing traders (holding positions for 1-10 days), checking FII DII data every evening after market close is ideal. For long-term investors, a weekly review of the 5-day net totals is sufficient. For intraday traders F&O data and Participant OI data (released the previous evening) is more relevant than cash market data.
-
Can FII DII data predict tomorrow’s market movement?
It is not a crystal ball, but it is the most reliable directional indicator available. Research shows that when FIIs are consistent net buyers for 3+ days in cash market AND hold a high long-to-short ratio in Index Futures the probability of a positive next-day market is significantly higher than average. Use it as one signal among several not as the only indicator.
Also Read: View today’s live FII DII cash market net buying selling data
Conclusion: Make FII DII Data Your Trading Edge
FII and DII data is not just numbers on a screen it is the footprint of smart money. Every time FIIs make a large net purchase or sale they are making a multi-billion rupee bet on the direction of the Indian market. Learning to read those bets is the closest thing to a trading edge that is freely available to every retail investor.
To summarize what you have learned in this guide:
- FIIs are foreign investors (hedge funds, pension funds) that are the primary drivers of market volatility
- DIIs are Indian institutions (LIC, mutual funds) that act as market stabilizers
- FII DII data is officially released by NSE and BSE after market close every trading day
- The most powerful signal is when both FII and DII are buying or selling in the same direction
- F&O and Participant OI data provides additional short-term directional signals
- Always look at 5-day trends, not single-day data, for reliable signals
Start tracking FII DII data every day. Visit FIIAndDIIData.com for live Cash Market Summary, F&O Activity, Options Data, and NSE Participant-Wise Open Interest all free, all in one place.